Hertz analytical solution
Hertz contact
A rigid sphere indents an elastic block. The computed normal force is compared with the Hertz solution at the actual indentation of the block surface.
Understand the analysis
A sphere pressing into an elastic surface.
The quarter model uses symmetry on two vertical faces, a fixed bottom and frictionless contact. A graded solid mesh resolves the contact region, while the surrounding block extends away from the indenter.
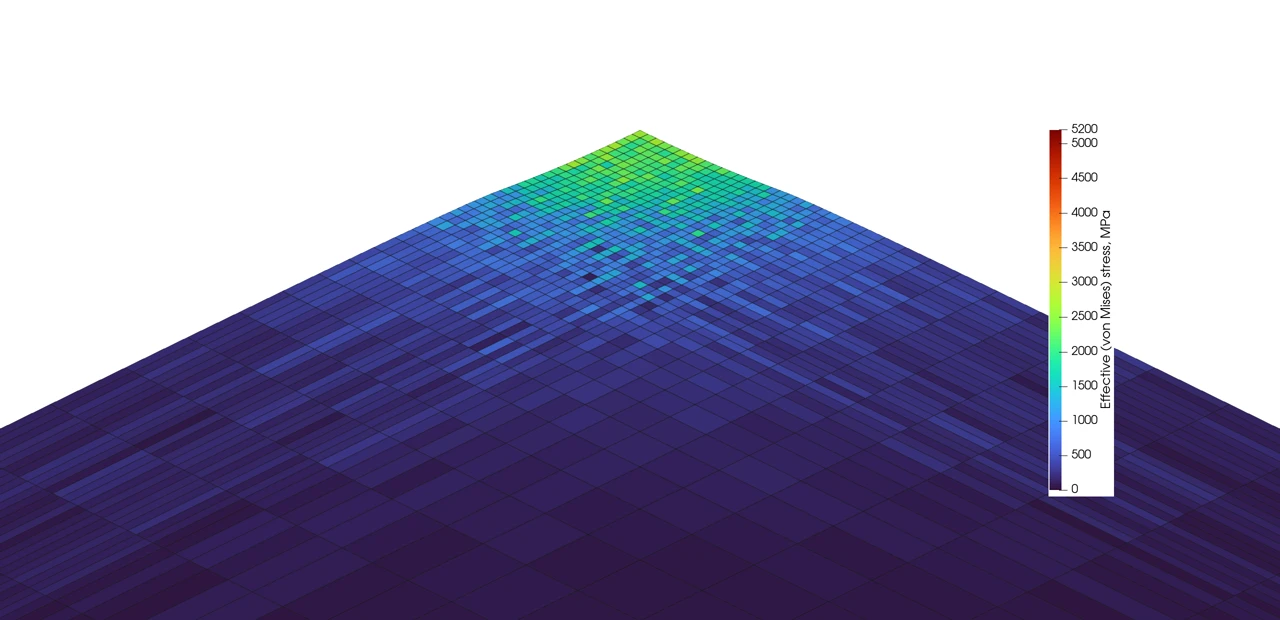
The sphere is hidden to show the block surface and local stress field.
Full size ↗Symmetry-face view with the rigid sphere visible. Deformation is shown at true scale.
Open video ↗Both views come from the same run as the force comparison. Color shows effective (von Mises) stress, 0–5,200 MPa; it is not contact pressure. The video includes loading and a hold period.
At an actual indentation of 0.546 mm, MinuteSim gives 427.9 kN and the analytical solution gives 418.0 kN. The graph below shows every recorded force sample, including the initial contact response and the hold period.
Force versus actual indentation.
Download plotted data ↓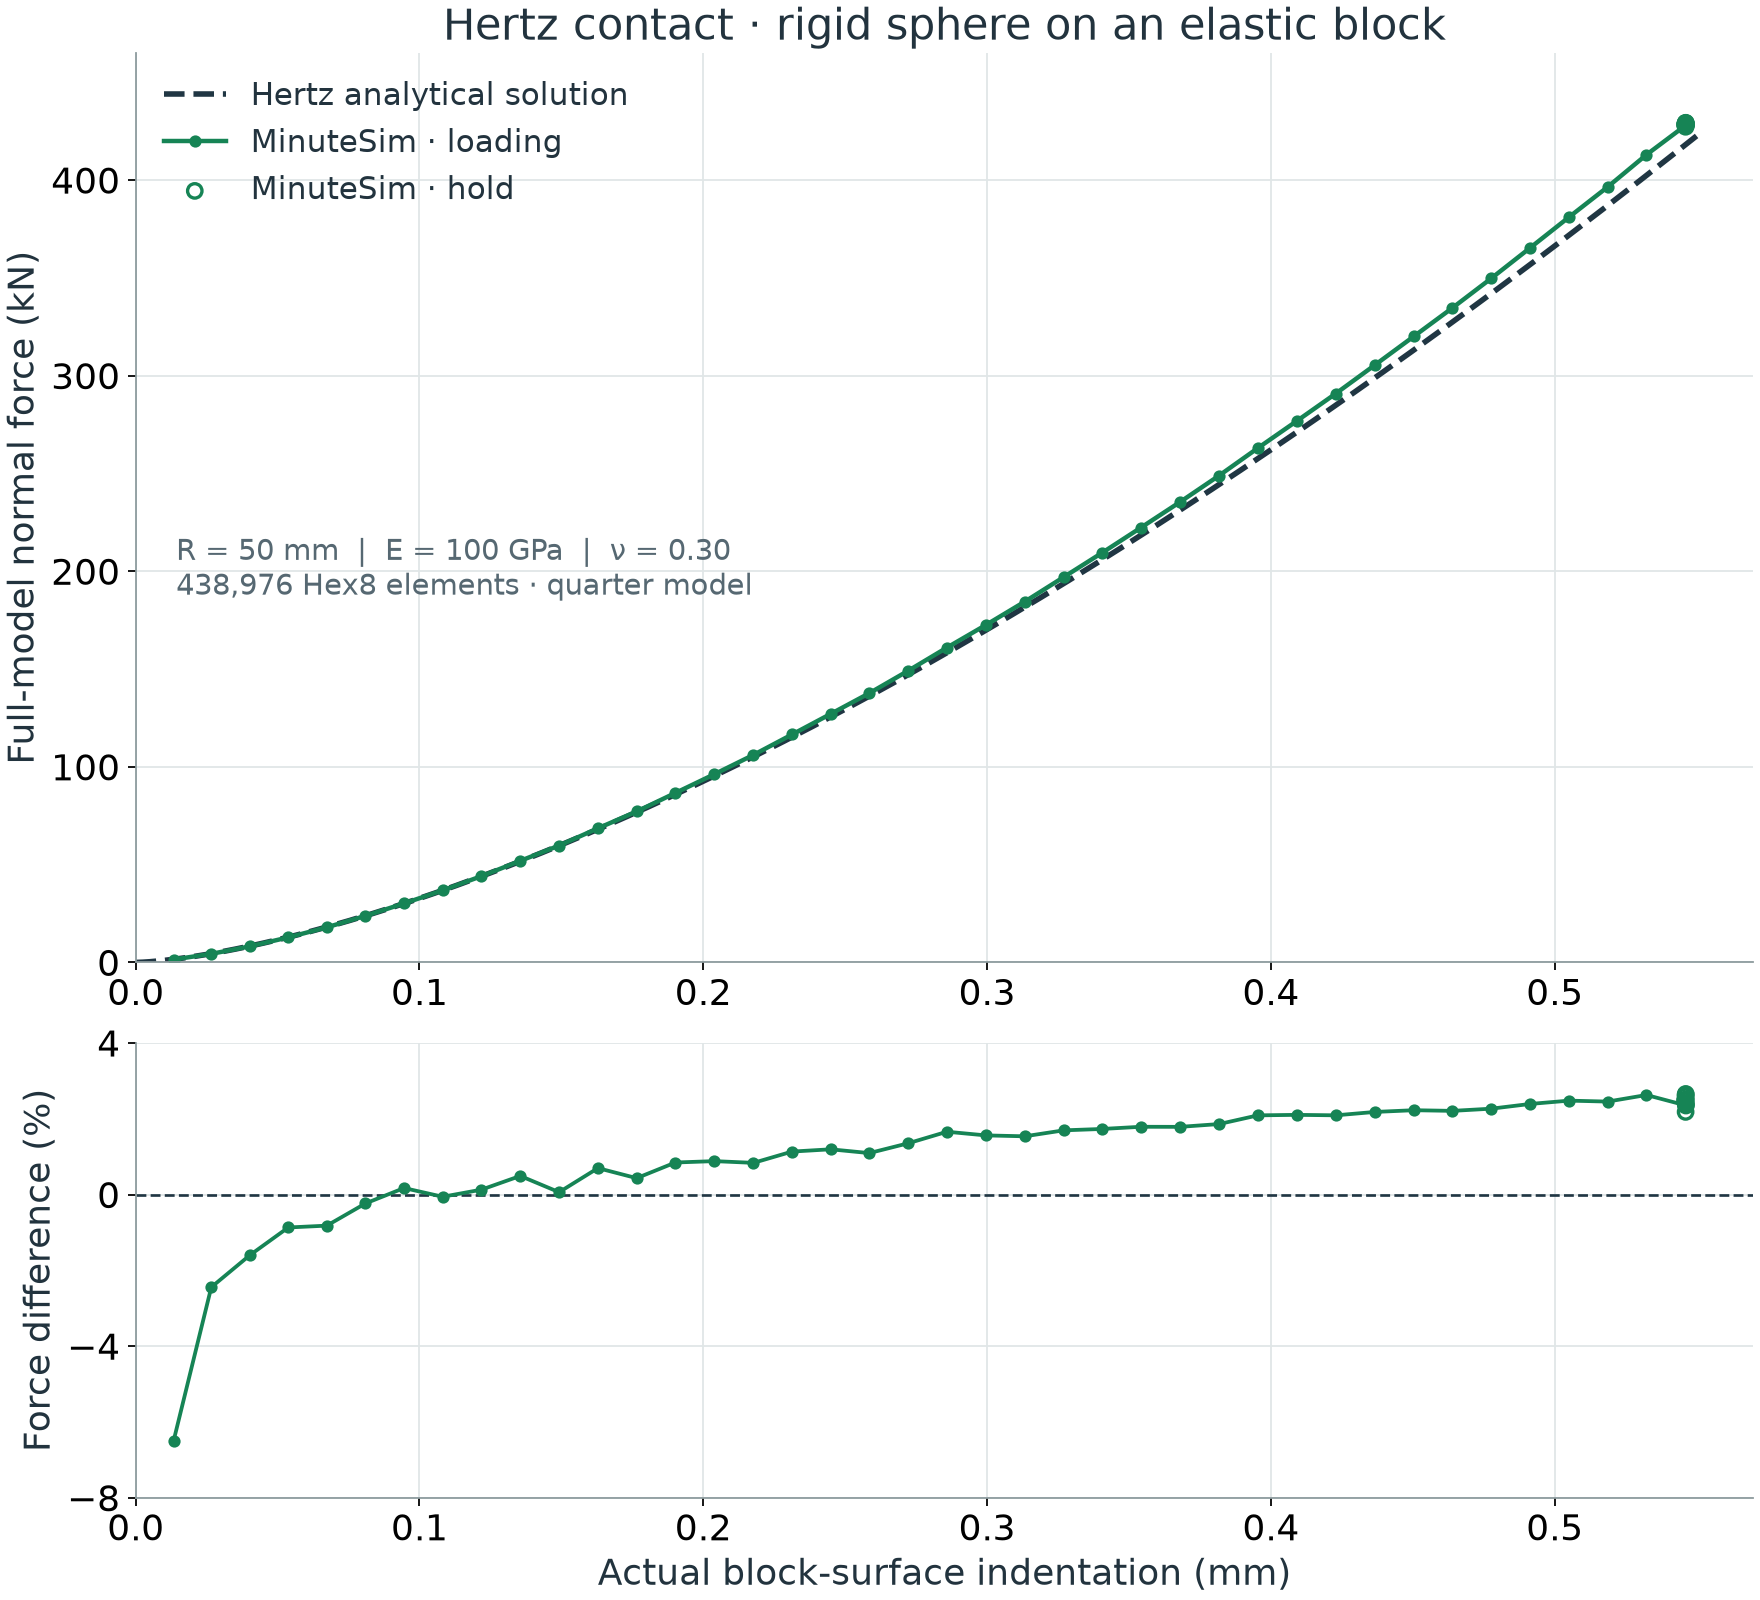
Comparison conditions
Model and loading
Rigid sphere radius: 50 mm. Quarter-block dimensions: 400 × 400 × 400 mm. Linear-elastic material: E = 100 GPa and ν = 0.30. The graded mesh contains 438,976 Hex8 elements, with a minimum cell size of 0.3125 mm. Prescribed sphere travel reaches 0.55 mm at 0.020 s and is held until 0.025 s.
What is compared
Full-model force is four times the magnitude of the quarter-model normal contact force. Indentation is the downward displacement of the block’s top node on the contact axis, interpolated in time to the force samples. It is not the prescribed sphere travel; the contact setup includes an initial 0.05 mm gap. Relative difference is 100 × (MinuteSim / Hertz − 1).
Reference and scope
The rigid-sphere Hertz solution is F = (4/3) E* √R δ3/2, where E* = E/(1 − ν²). See the CompuTiX Hertz contact relations for the force–indentation relation.
The reference assumes frictionless elastic contact with a half-space. This calculation uses a finite block and explicit loading. It is a comparison for this mesh and loading configuration, not a mesh-convergence study or a validation of the local stress field.
The +2.4% summary is an endpoint difference, not a maximum over the entire history. The initial recorded sample differs by −6.5%; at indentation ≥0.1 mm, loading samples differ by −0.06% to +2.63%. The final hold sample differs by +2.59%. All 50 force samples are included in the chart and downloadable data.
Run conditions: MinuteSim FP32 on an NVIDIA GeForce RTX 4060. Source results: 8 October 2026.
SUPPORTED · Numerical comparison record for the stated configuration. Broader validation and capability limits are described on the Evidence page.