Closed-form reference
Kinematic hardening
A single-element loading, reversal and return cycle checks kinematic, mixed and isotropic hardening against the corresponding closed-form 1-D response.
Understand the analysis
Stretch. Reverse. Load again.
A single element follows a prescribed tension–compression cycle. The stress–strain loop checks the response after the loading direction reverses. The visual below shows the pure kinematic case; mixed and isotropic curves remain as comparison cases in the graphs.
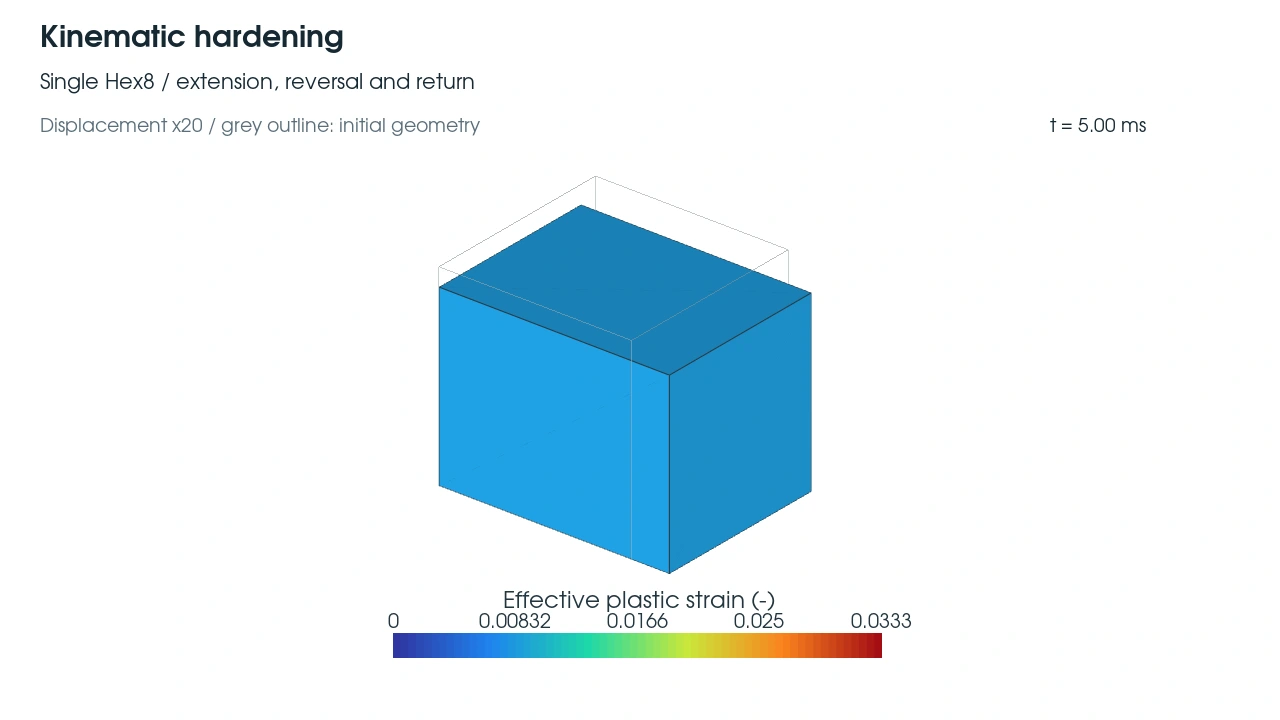
Hex8 at 5 ms during the kinematic hardening cycle (beta 0).
Full size ↗The recorded kinematic cycle, with accumulated plastic strain shown in colour.
Open video ↗Rendered from the saved beta 0 Hex8 result used in the comparison. Displacements are enlarged 20× for visibility; the colour values are unchanged. The grey outline shows the initial cube.
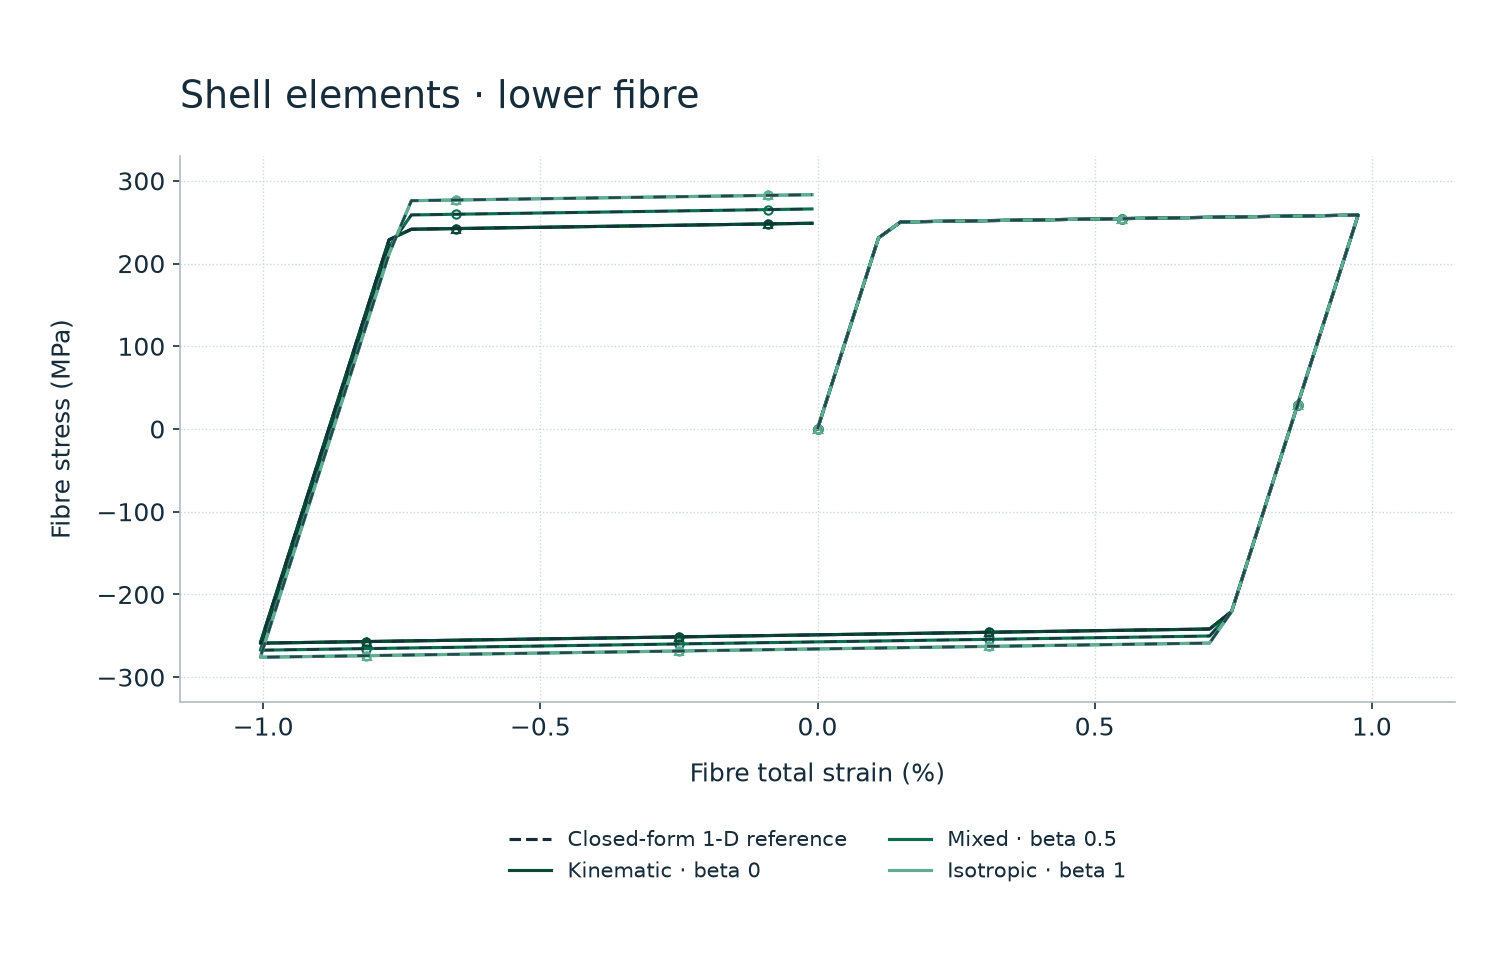
Hex8, Tet10, Tet4, Quad4 and Tri3 follow the closed-form response at the plotted scale. The largest sampled difference is 0.44844% of the 250 MPa initial yield stress. The table below separates the overlapping curves.
One strain cycle. An analytical reference.
Download plotted data ↓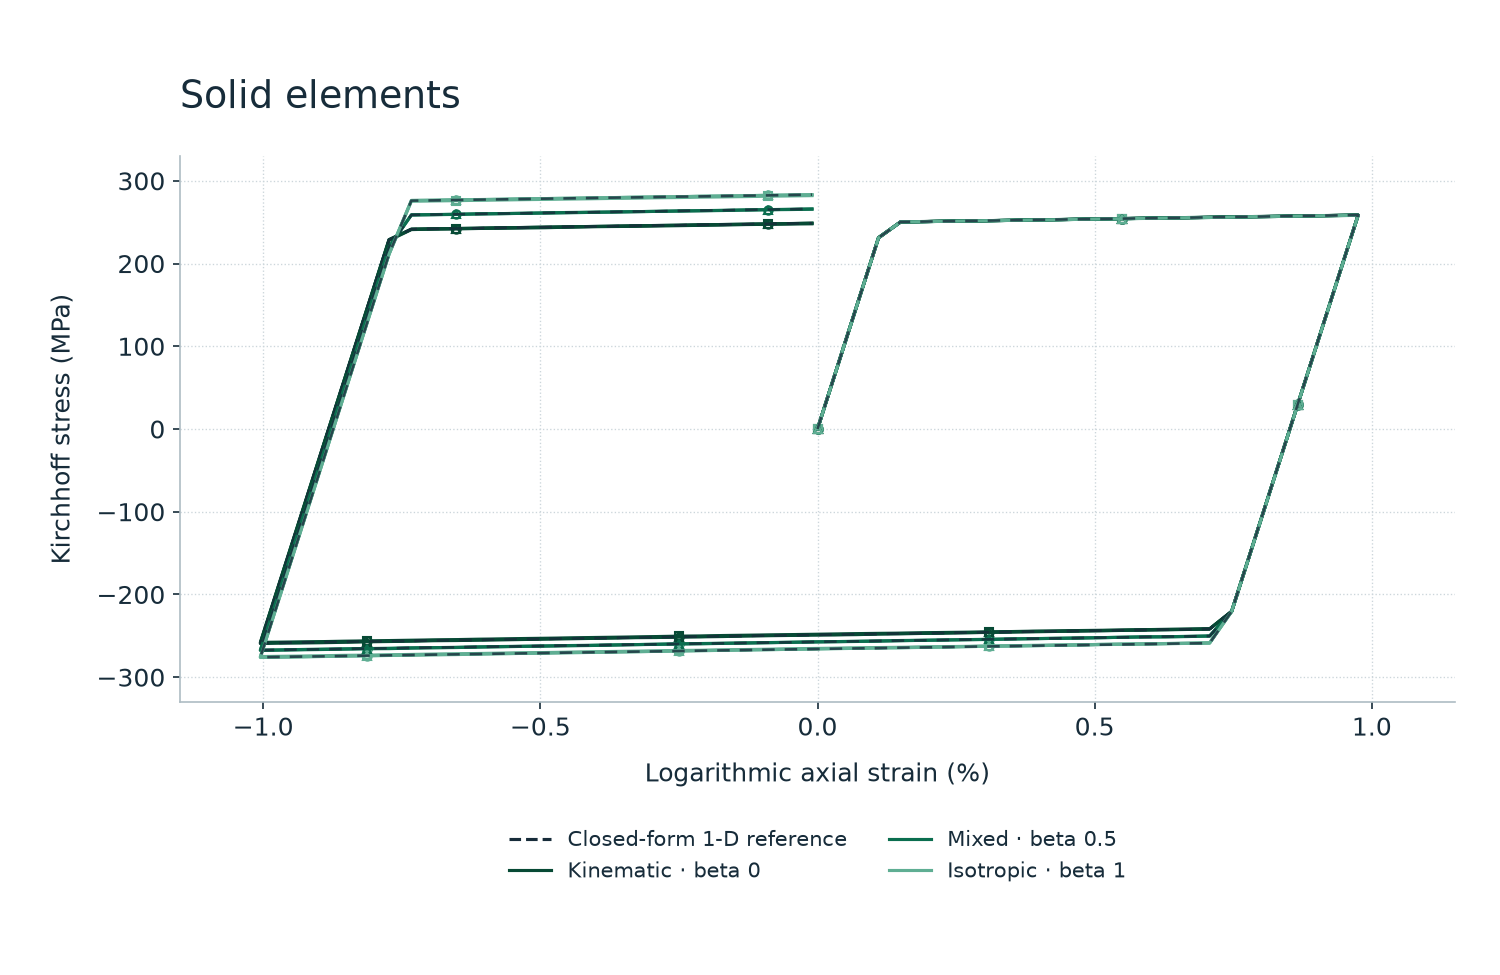
Differences behind the overlapping curves
Maximum absolute stress difference divided by the initial yield stress (250 MPa), over 101 output frames. These percentages are not relative errors divided by the instantaneous stress.
| Element | Kinematic · beta 0 | Mixed · beta 0.5 | Isotropic · beta 1 |
|---|---|---|---|
| Hex8 | 0.128% | 0.102% | 0.123% |
| Tet10 | 0.376% | Not run | 0.448% |
| Tet4 · default | 0.274% | 0.169% | 0.174% |
| Quad4 · 5 points | 0.0213% | 0.0232% | 0.0203% |
| Tri3 · 5 points | 0.0193% | Not run | 0.0131% |
Reference and test scope
One-dimensional cycle
Elastic modulus 210,000 MPa, initial yield stress 250 MPa and tangent modulus 1,000 MPa. The cycle runs from zero strain to approximately +0.975%, then −0.975%, and back. Each analytical curve uses that run’s strain history.
Solid and shell measures
Solids compare Kirchhoff stress with logarithmic axial strain. Shell plots show the lower fibre; shell errors use the worse of the lower and upper fibres. Markers identify Hex8/Quad4 (circles), Tet10 (squares), and Tet4/Tri3 (triangles). Tet10 and Tri3 have no mixed beta 0.5 result.
The Quad4 isotropic five-point value was computed from the same analytical comparison method; it is not the separate two-point value in the earlier summary. Isotropic hardening is the control case.
Run conditions: MinuteSim FP32 on an NVIDIA GeForce RTX 4060. Source results: 5–6 October 2026.
SUPPORTED · Numerical comparison record for the stated configuration. Broader validation and capability limits are described on the Evidence page.