Drop impact / Multi-part assembly
Phone corner drop
Follow a corner impact from the whole device to its internal components. A phone-sized assembly strikes a rigid floor, rotates and rebounds over 30 ms of simulated time.
Five views. One simulation. Each segment repeats the same 0–30 ms response from a different view. The full video lasts about 68 seconds; the time printed in each frame is simulation time. Choose a view above to jump to its start.
The device is initialized just above the floor at the speed corresponding to a 1.5 m fall. The sequence shows the first corner impact, the opposite end striking the floor, and subsequent rebound and rotation.
Model and impact conditions
This is an own-design phone-sized assembly with simplified glass, frame, bumper, battery, circuit board and electronic components. It illustrates a configured drop-impact calculation rather than the performance of a particular commercial phone.
| Device envelope & mass | 150 × 75 × 8 mm · nominal mass 130 g |
|---|---|
| Device mesh | 9,506 elements: 6,074 Quad4 shells and 3,432 Hex8 solids · 10,586 nodes. The separate fixed visual floor is excluded from these counts. |
| Initial condition & gravity | Corner first; initial clearance 2 mm above the floor, with 5.425 m/s downward velocity. The free fall from 1.5 m is represented by this initial speed. Gravity remains active at 9.81 m/s². |
| Floor & component contact | Frictionless rigid floor; five internal contact interfaces with friction coefficient 0.2. The grey floor plate is a visual aid, drawn 0.3 mm below the contact plane. |
| Material idealizations | Elastic glass, circuit board and simplified internal components; elastoplastic aluminium frame and metal shields. |
| Bumper assumption | Linear elastic, E = 30 MPa and ν = 0.45. This is a selected material idealization. |
| Glass reference stress | Assumed 600 MPa for the displayed stress ratio R. It is not a measured strength for a specific device. |
| Computed interval | 0–30 ms, completed; 301 saved states at 0.1 ms intervals. |
| Video sampling | 151 result states per view, at 0.2 ms intervals. Each view ends with a short hold; no additional simulation states are interpolated. |
| Execution | NVIDIA GeForce RTX 4060 · single precision |
Whole-device motion
The first corner reaches the floor at approximately 0.4 ms. The other end strikes at about 10 ms; the device rebounds and rotates, with the first corner approaching contact again around 17.5 ms and lifting away from about 18 ms.
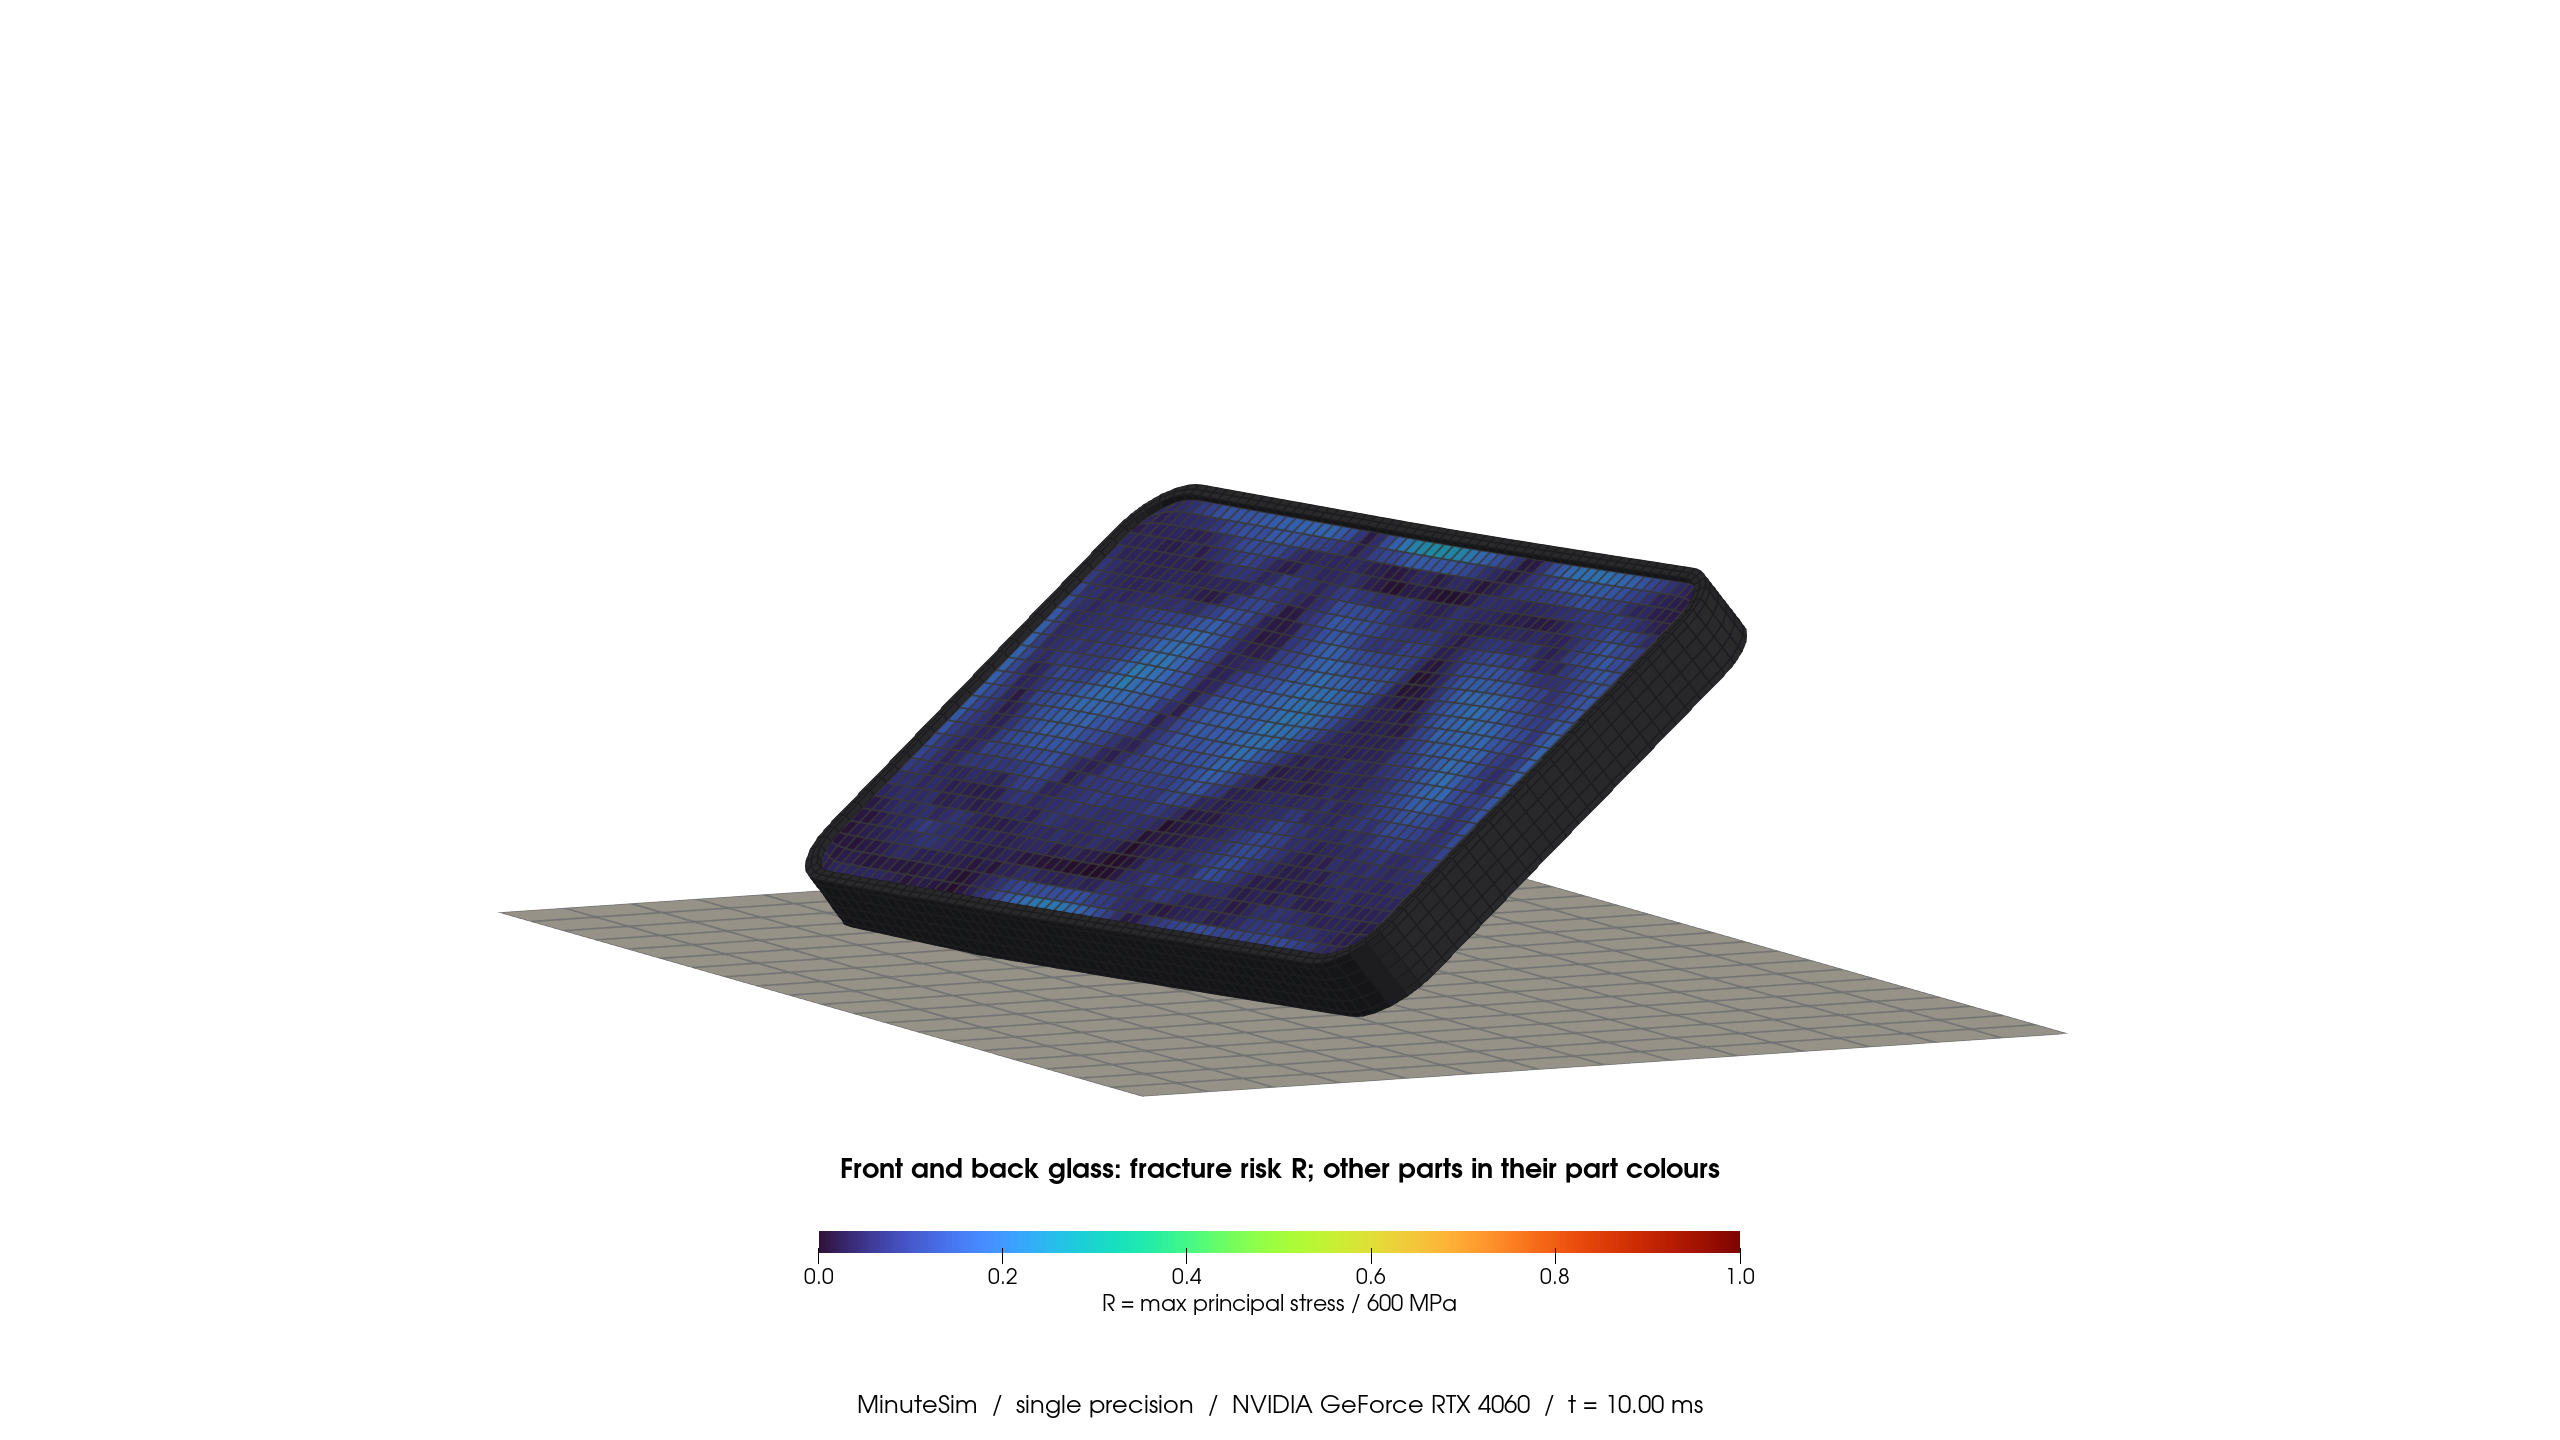
A fixed camera is fitted to the full motion envelope. Glass colors show the stress ratio R; other parts retain their component colors.
View full-size image ↗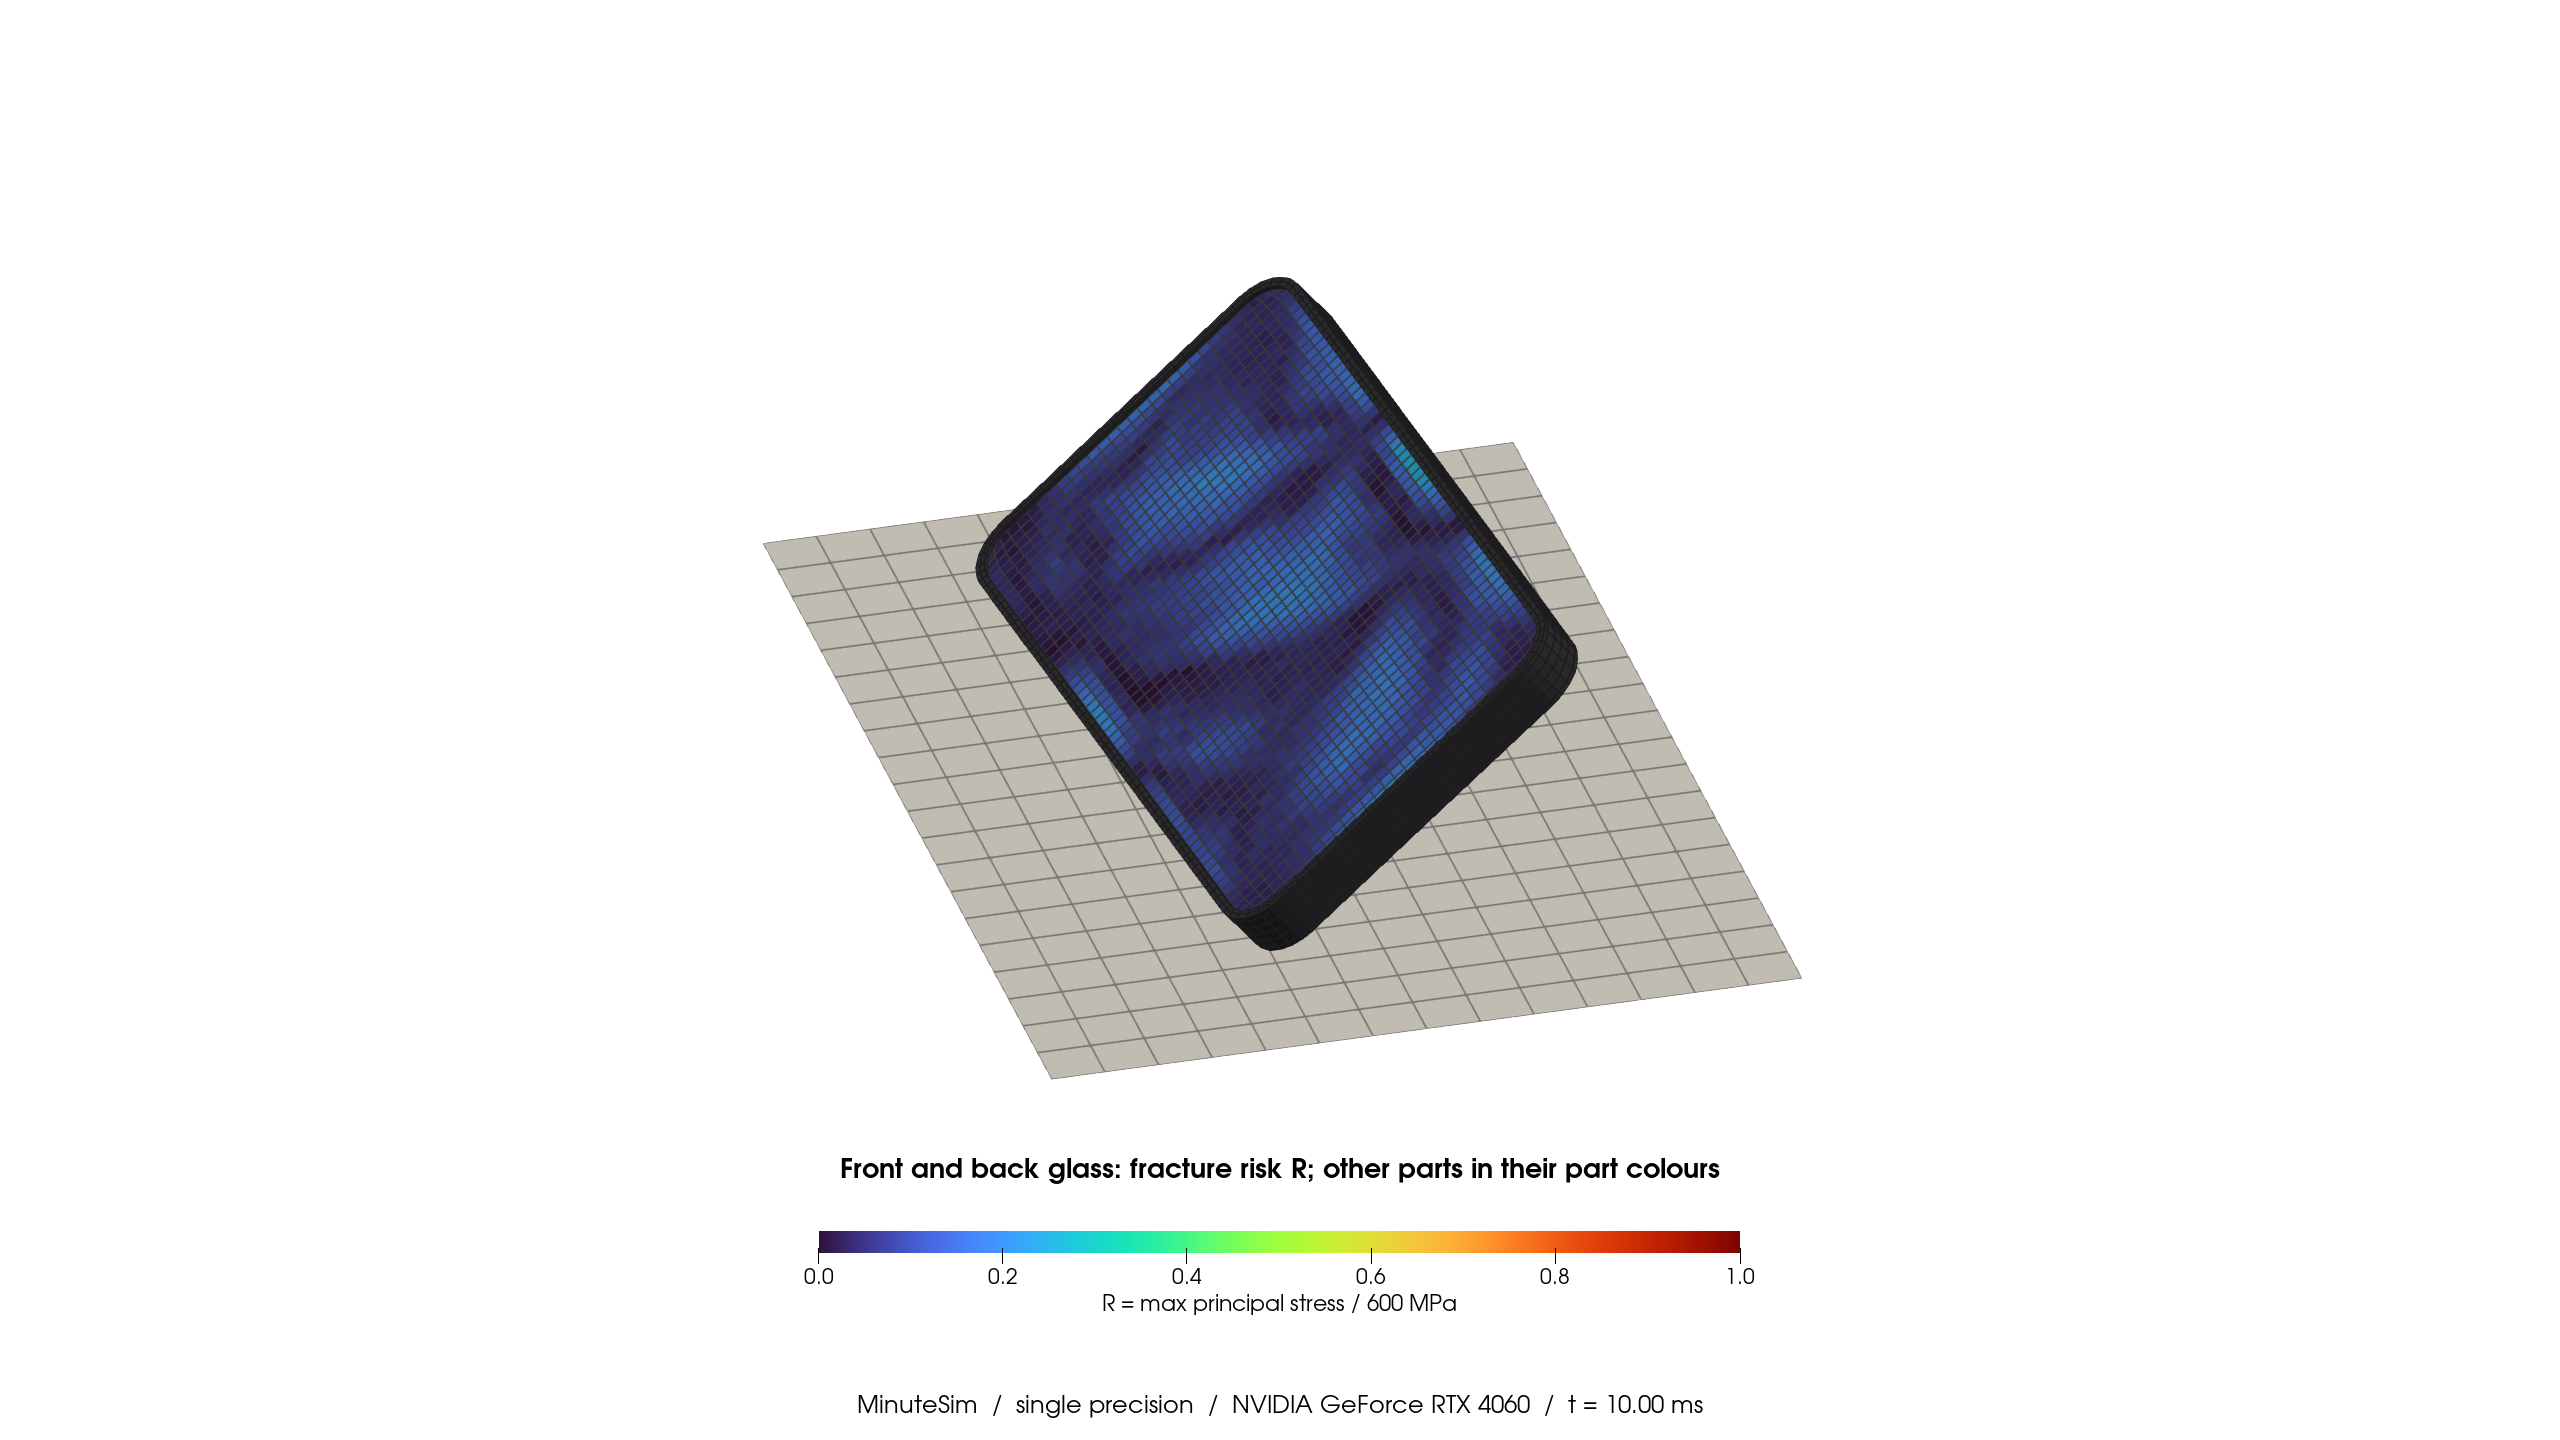
The complete device is shown from the front-glass side, preserving its computed geometry and mesh.
View full-size image ↗Glass and interior at the same instant
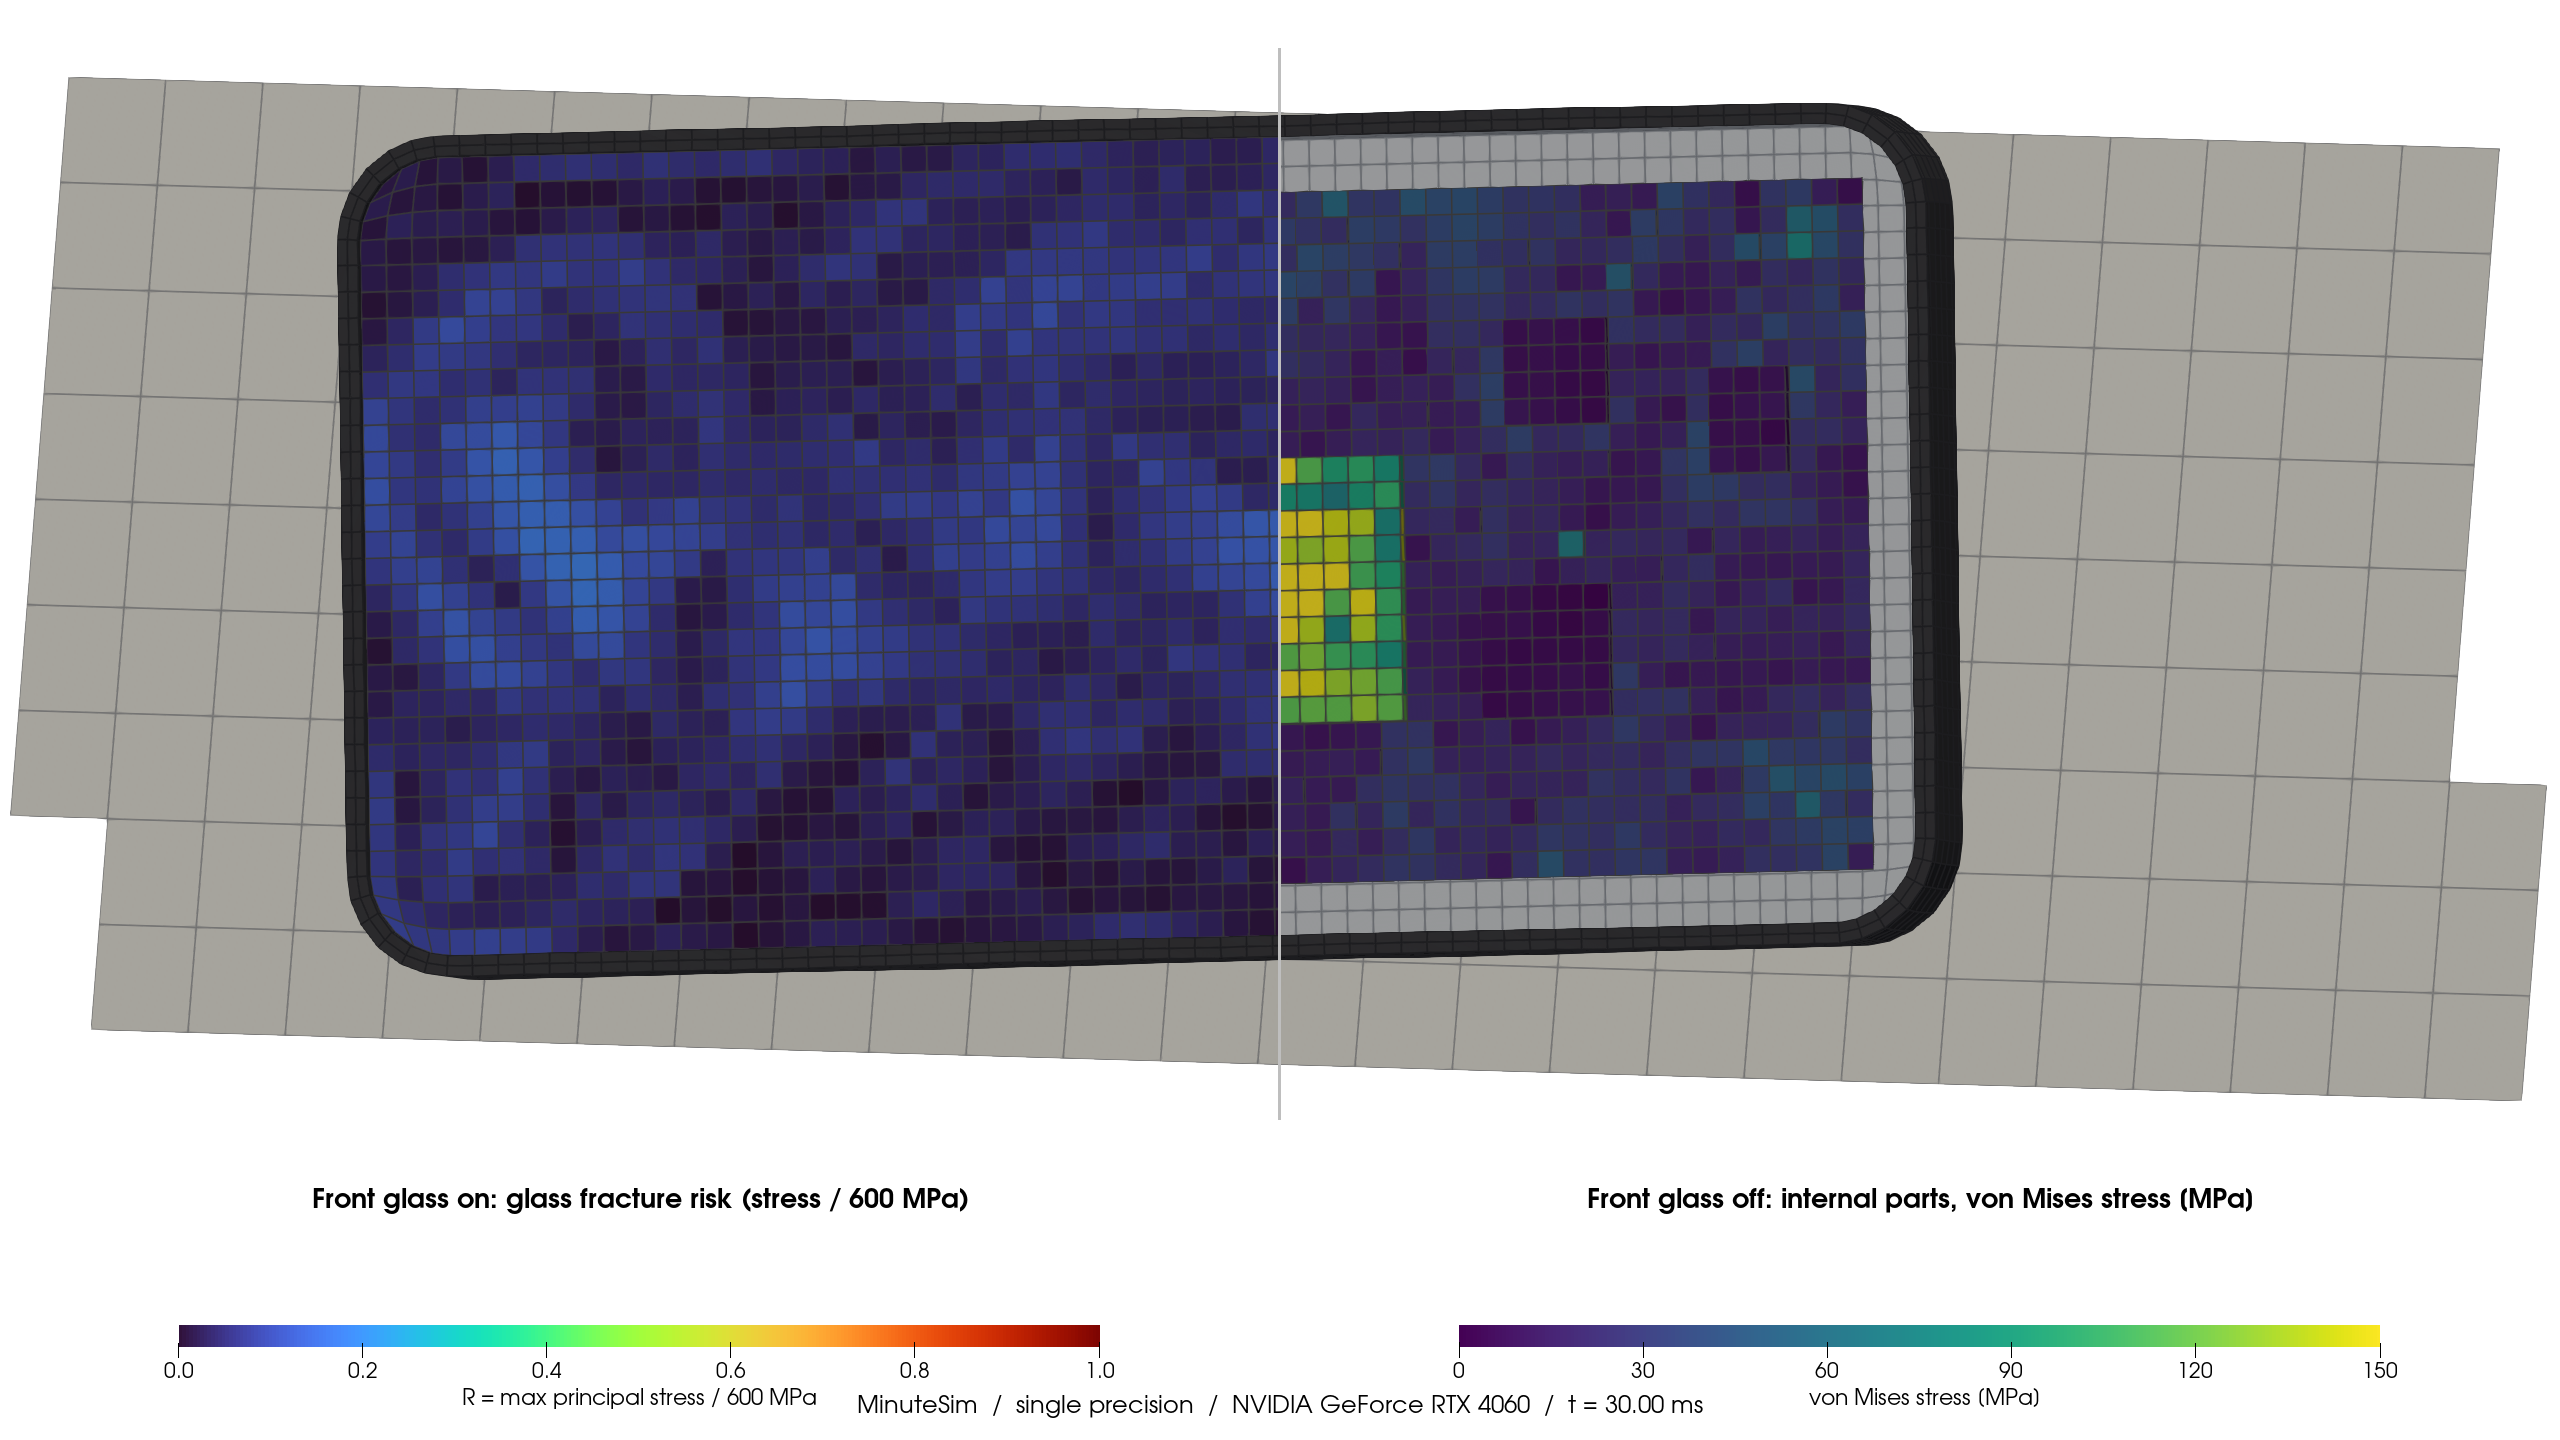
Both halves show the same state and camera. The divider changes only what is visible: glass stress ratio on the left, internal von Mises stress on the right. The device has not physically split.
View full-size image ↗Inside the assembly
These two views move with the device so that the board and components remain easy to inspect. The front glass, bumper and visual floor plate are hidden; the remaining geometry is shown as computed.
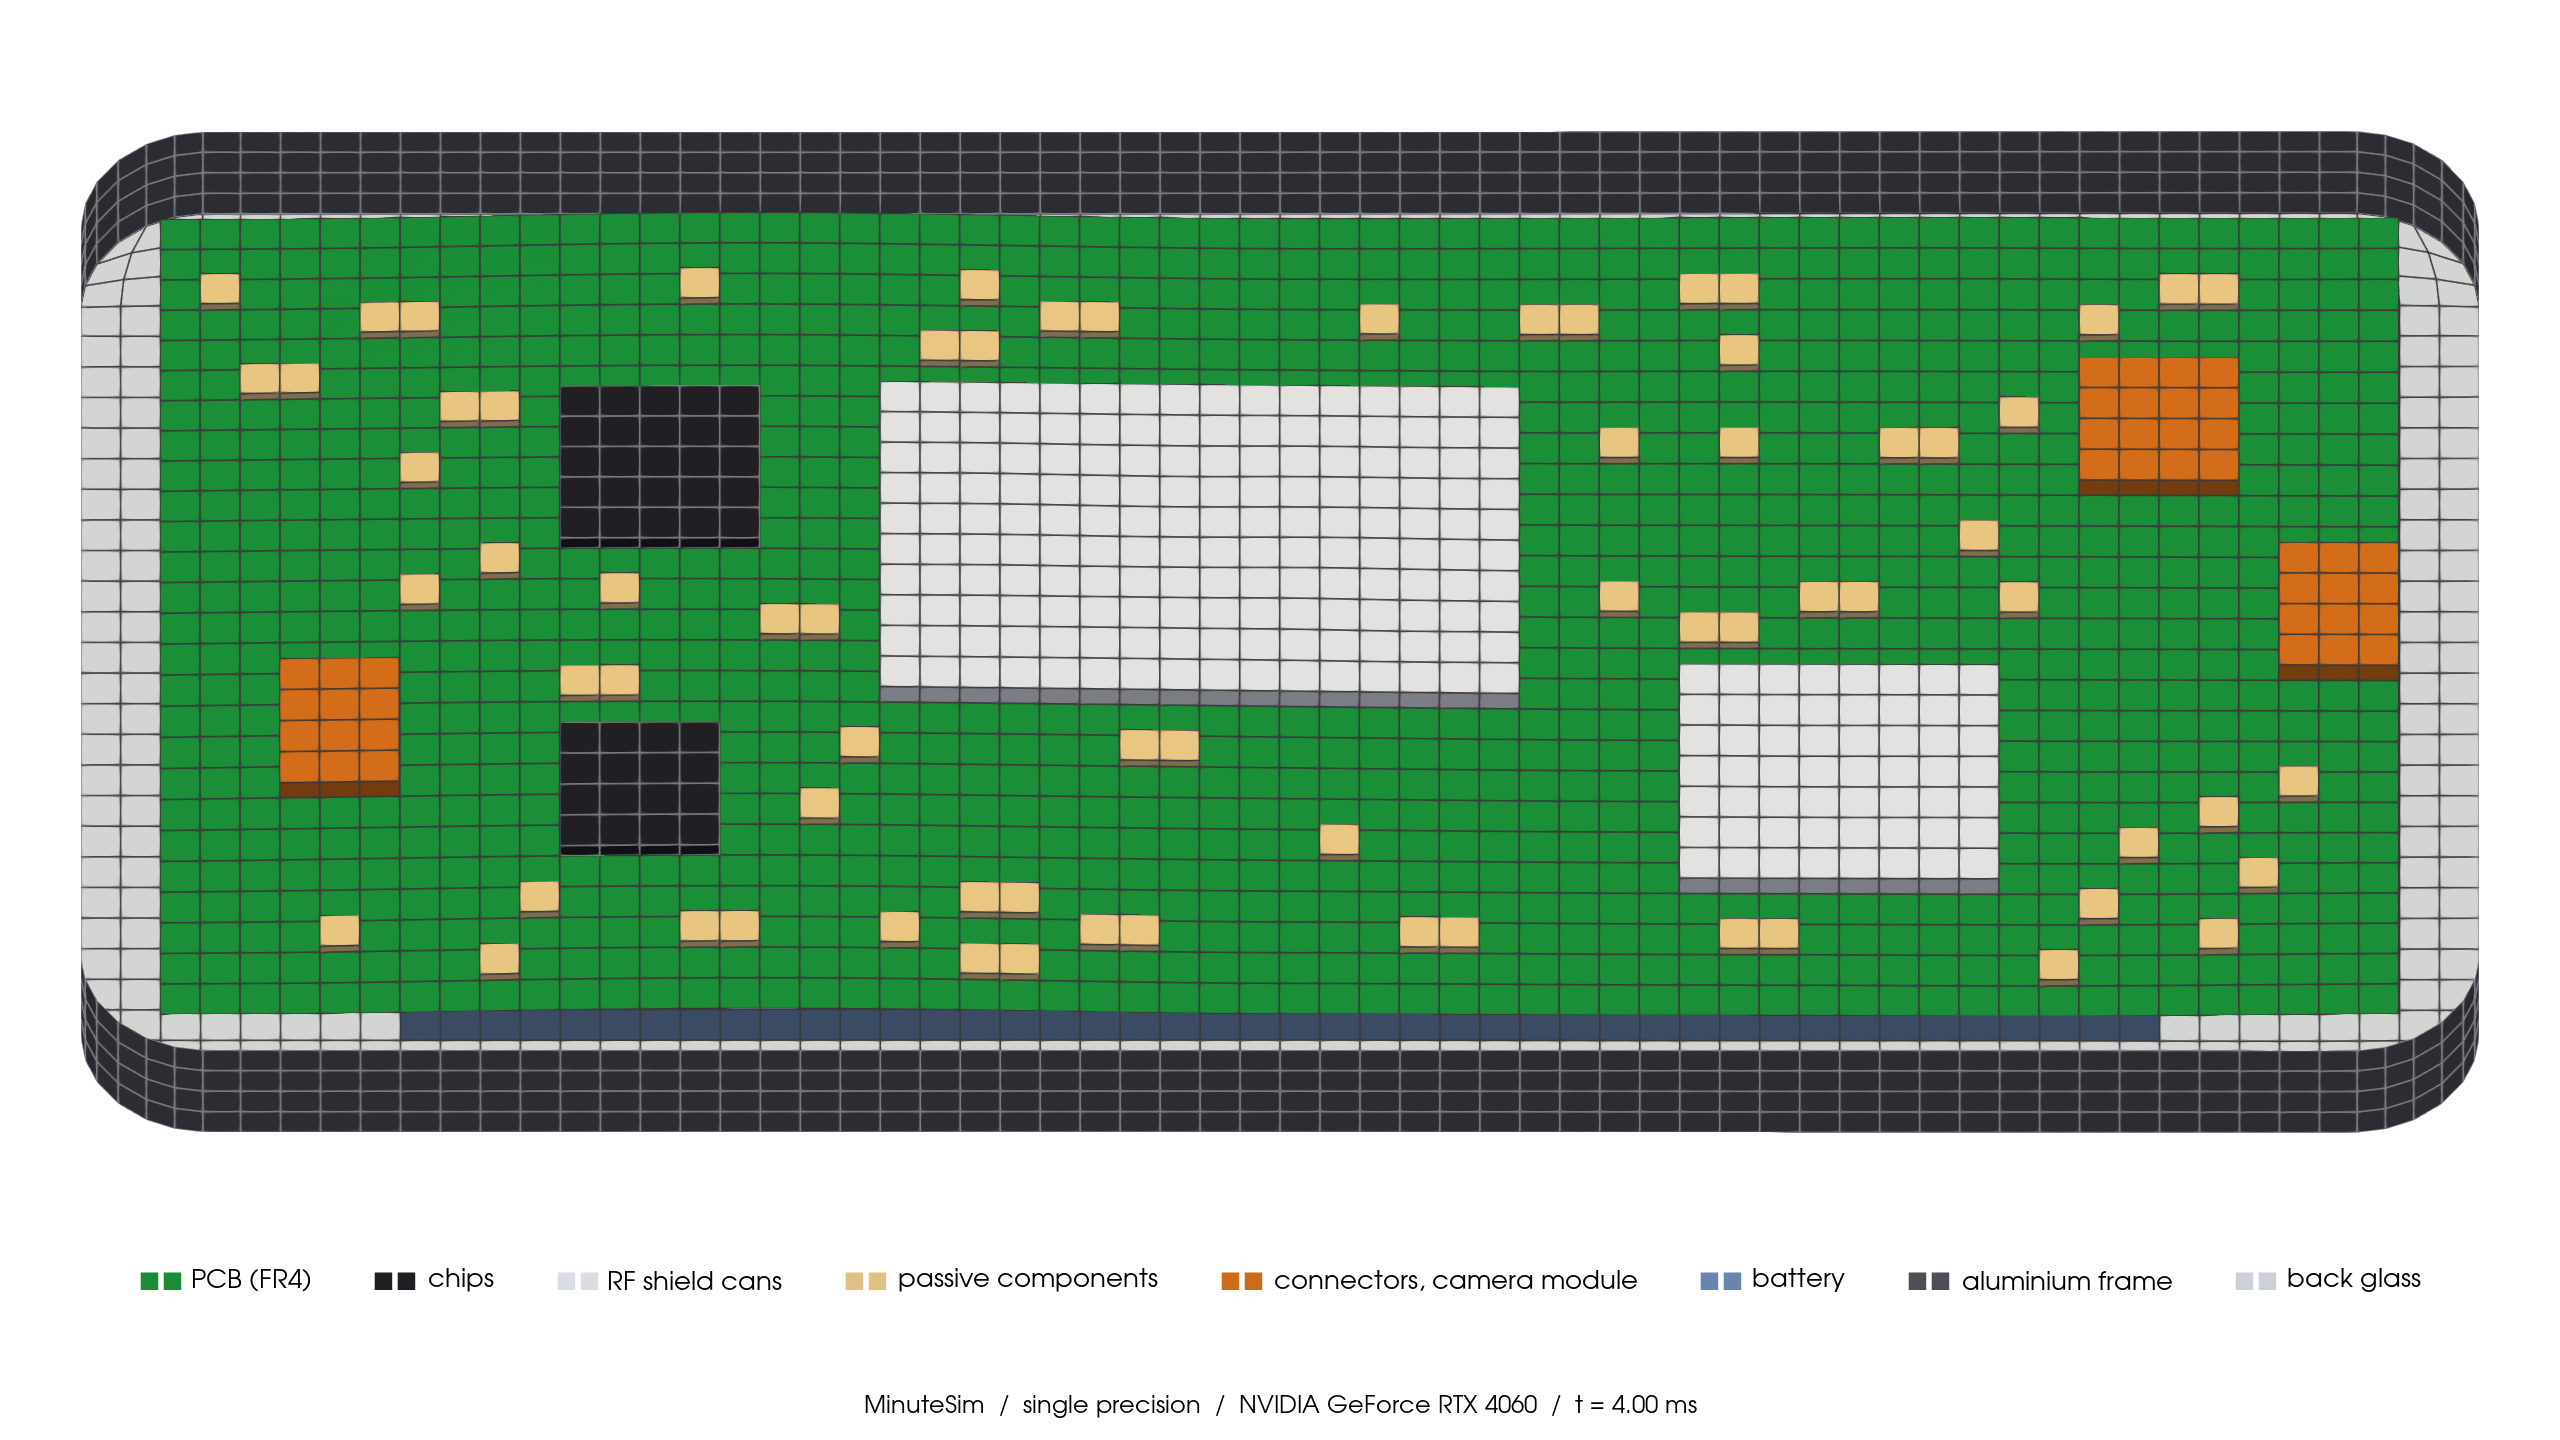
Part colors distinguish the board, chips, shield cans, passive components, connectors, camera module, battery and frame.
View full-size image ↗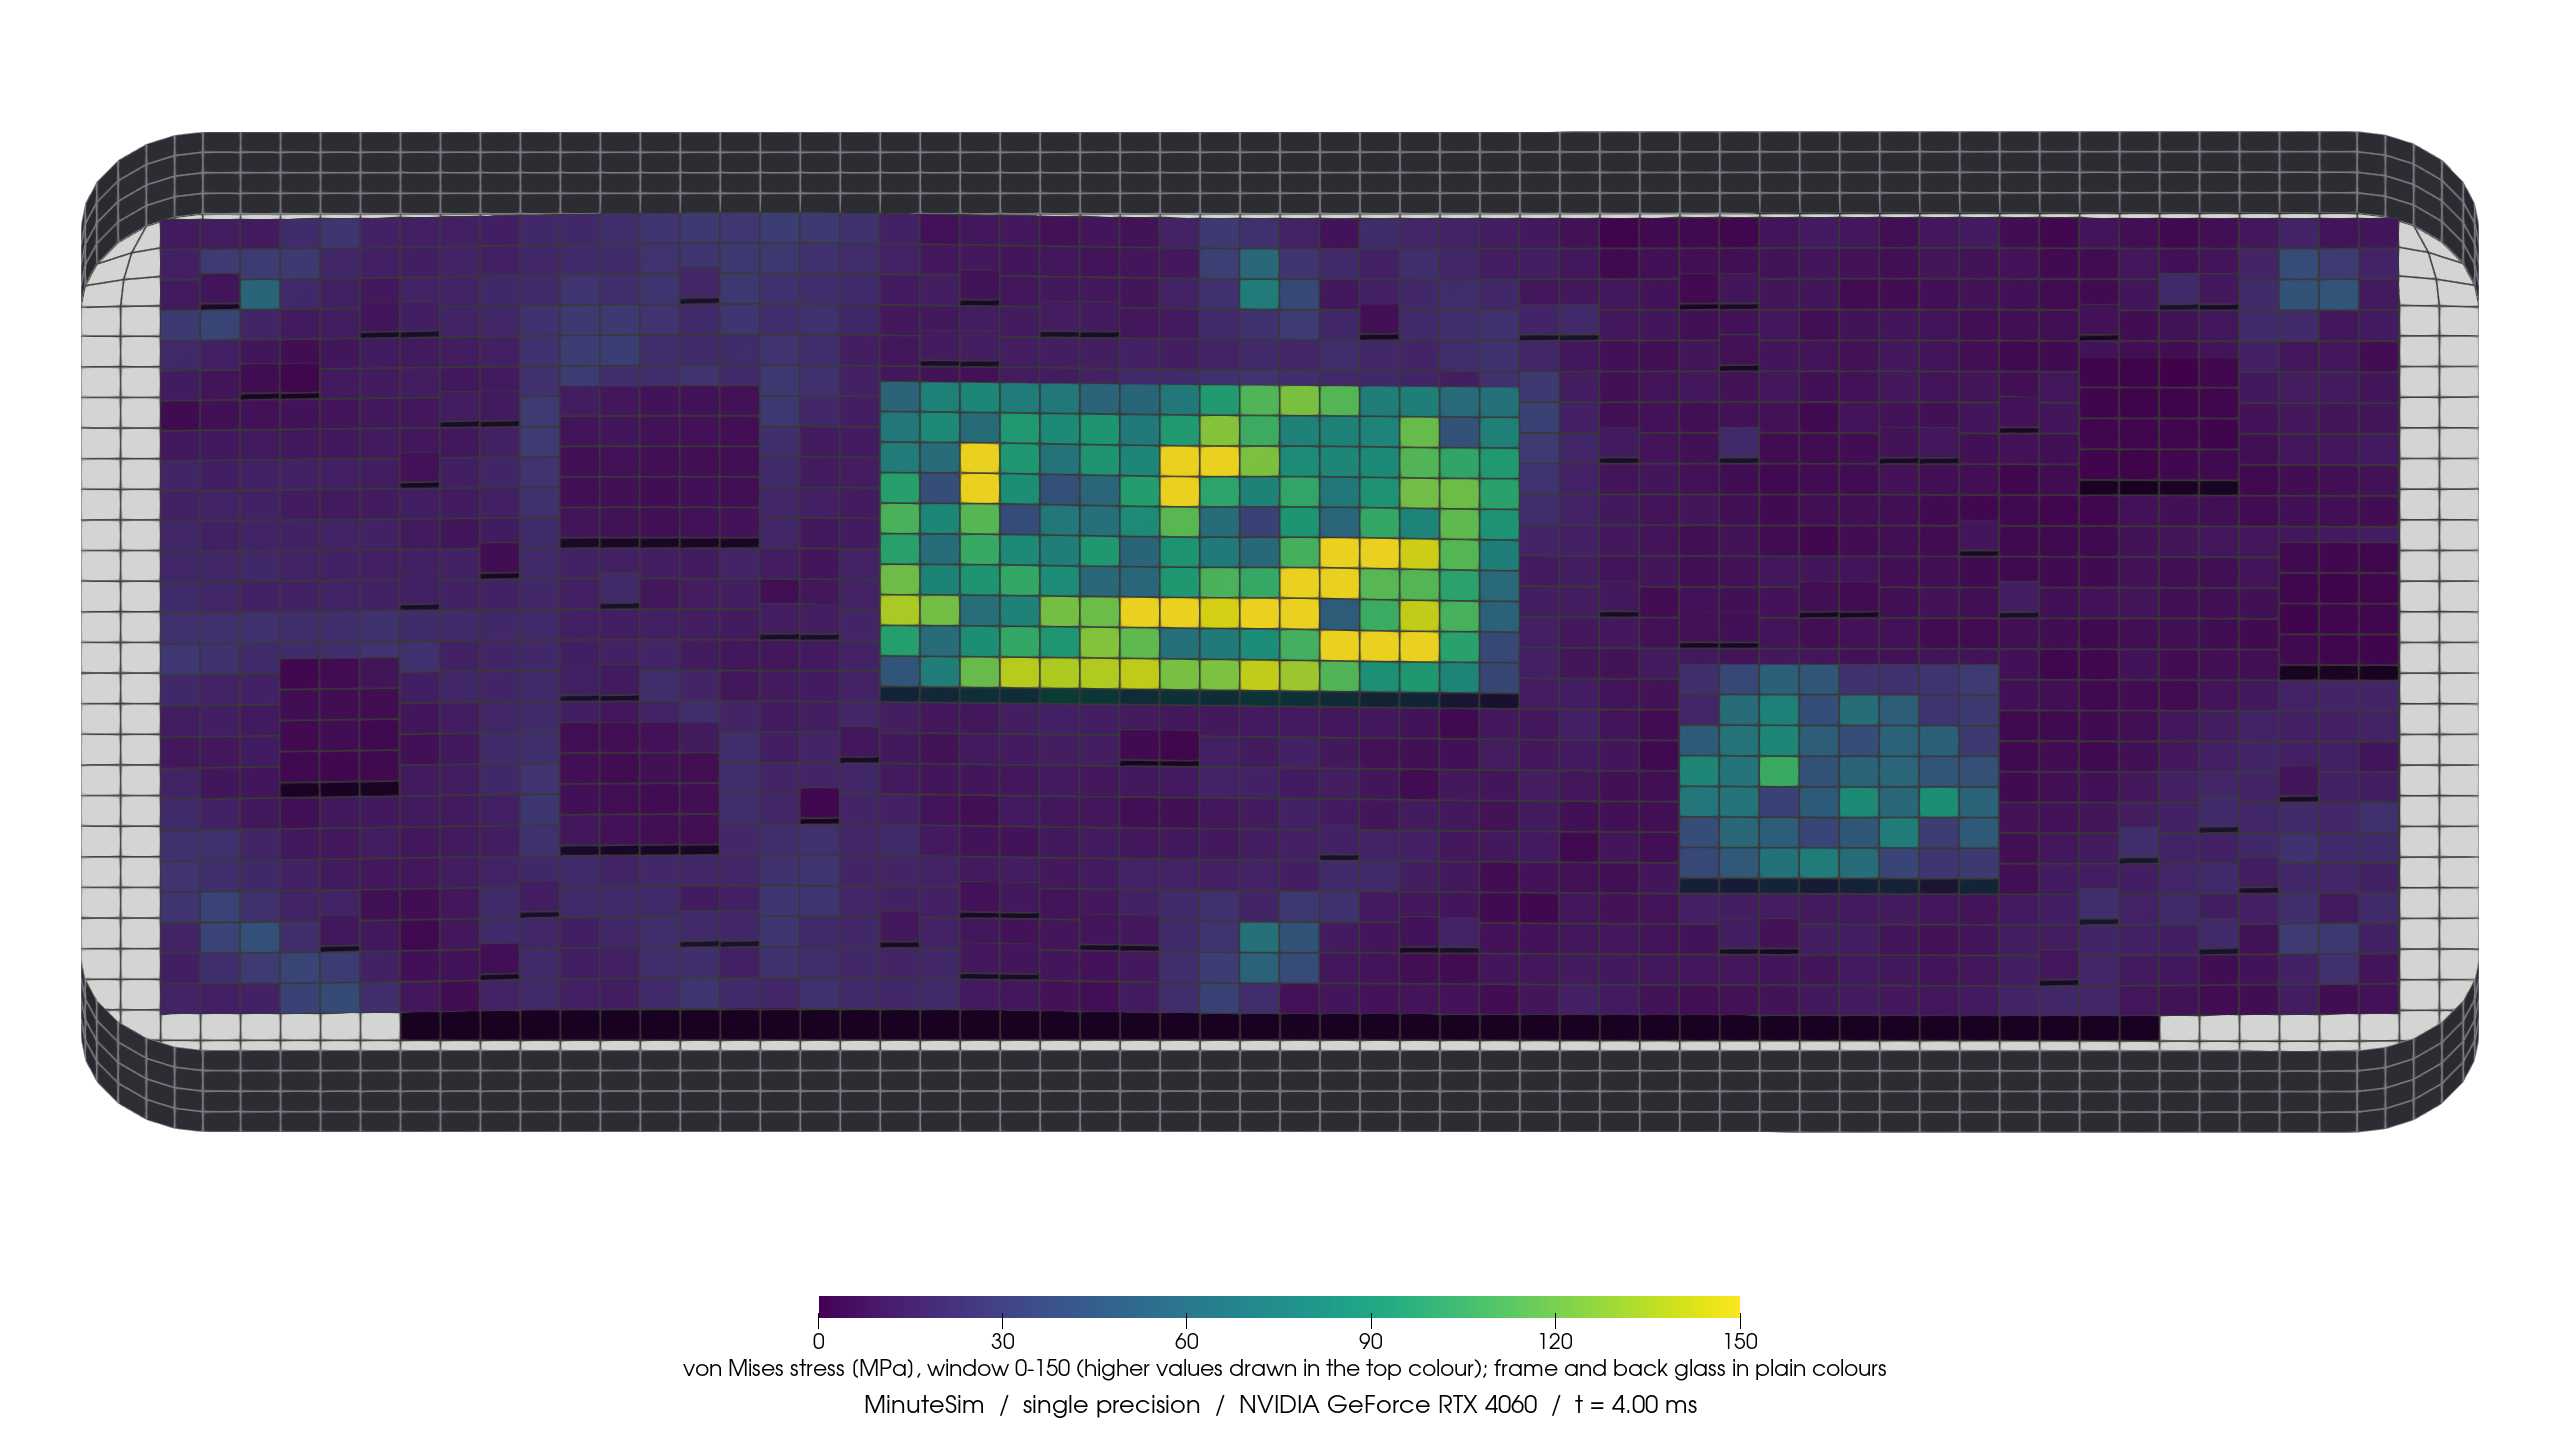
The same interior is colored by stress. The frame and back glass retain plain component colors.
View full-size image ↗Reading the result fields
Glass stress ratio
R is the maximum tensile principal stress across the upper and lower glass-shell surfaces, divided by the assumed 600 MPa reference. Compressive values are shown as zero. The fixed color window is 0–1; higher values use the top color. The media’s “fracture risk” label denotes this stress ratio, not a probability of failure or simulated crack growth.
Internal von Mises stress
The fixed color window is 0–150 MPa. Larger values remain in the result but use the top color. Over the displayed interior states, the recorded maximum is approximately 339 MPa and about 2.4% of displayed cell-state samples exceed 150 MPa.
Scope of this example
The model demonstrates a mixed shell–solid assembly, internal component contact and rigid-wall impact. The material properties and glass threshold are modelling assumptions. No independent experimental or analytical reference is compared here, so these contours do not establish drop-test accuracy, glass fracture or the durability of a commercial product.
SUPPORTED · Configured drop-impact demonstration. Separate numerical comparisons are available in Accuracy.