Forming / Experimental comparison
ESAFORM 2021
Cup drawing.
A circular aluminium blank becomes a cup with an uneven rim. Compare the drawing force and the four-ear profile with the experiment and 11 published shell and continuum-shell configurations.
Understand the analysis
From a flat blank to four ears.
A rigid punch moves the AA6016-T4 blank through a circular die. The blank holder controls draw-in; directional plastic response produces the varying rim height known as earing.
Two views of the same 0–16.5 ms calculation. The second view hides half the model for visibility; the analysis itself covers the full 360° blank.
Open video ↗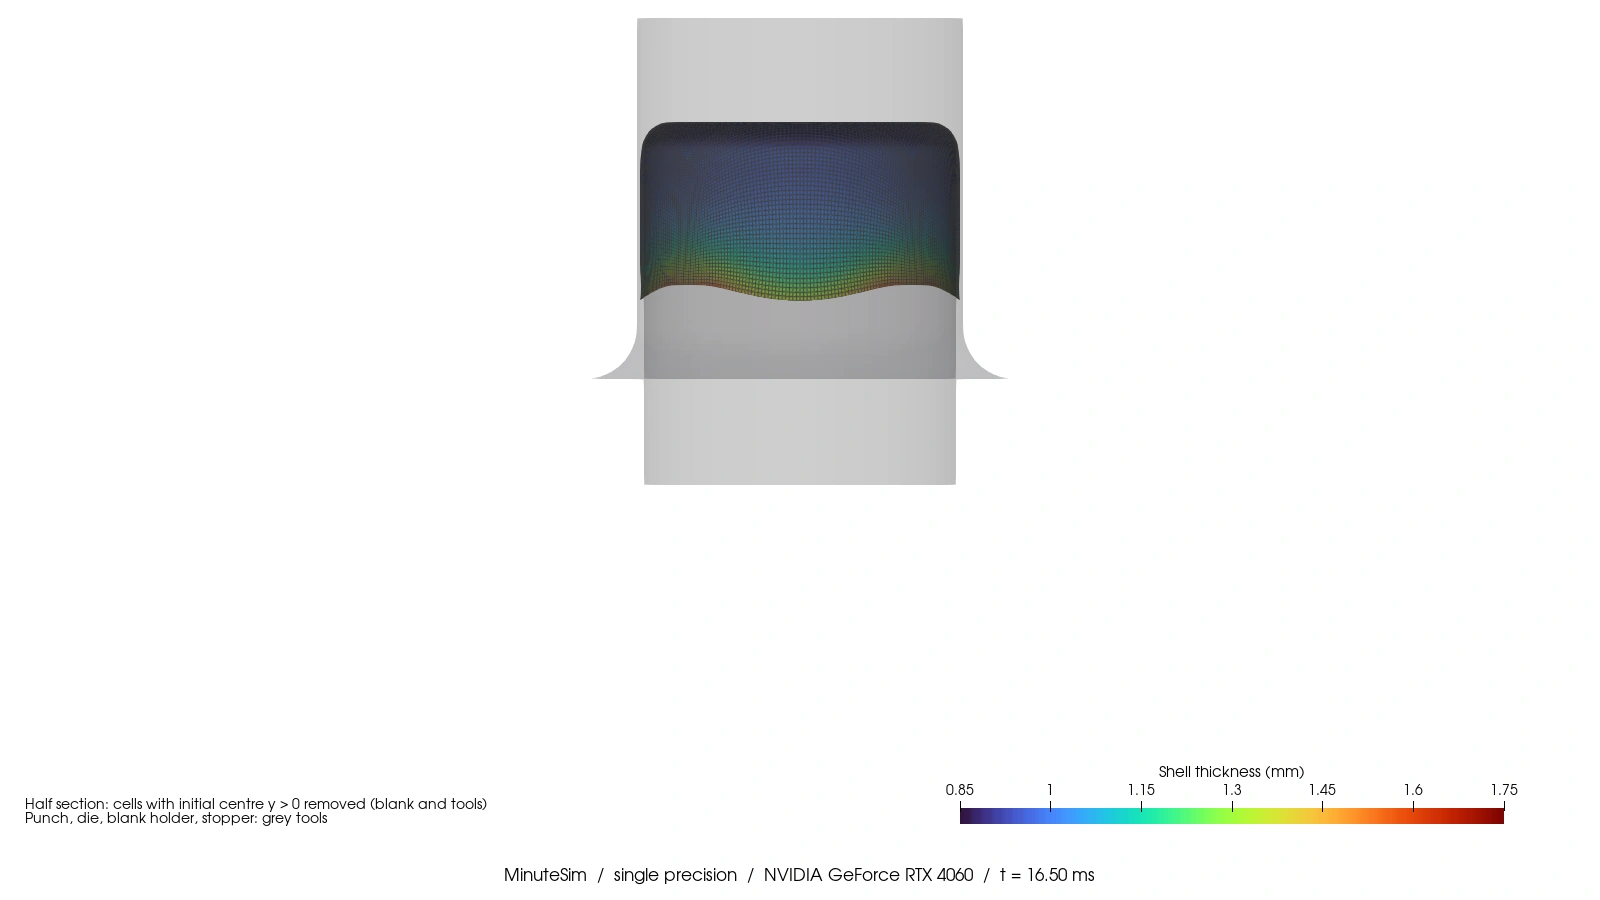
What the colors show
Shell thickness in millimetres, on a fixed 0.85–1.75 mm scale. The computed range over the saved states is 0.888–1.545 mm. Grey surfaces show the tooling and stopper; the oblique view hides the die.
Geometry is shown at its computed scale. Video duration is playback time.
Open the final section ↗Force and shape, side by side.
Experiment 40.3 kN
Difference +4.8%
Experiment 34.14 mm
Difference −0.84 mm
Experiment 2.29 mm
Difference +0.81 mm
The calculation forms four ears, with a lower average cup height and larger ear amplitude than the experiment. The later force response also differs; both stages are retained below.
01 / Force response
Punch force through the stroke.
Open full-size chart ↗The complete 0–60 mm and 0–105 kN axes retain the high late-stroke responses in the published configurations. MinuteSim uses 1.4 mm clearance, rather than the experiment’s nominal 1.2 mm.
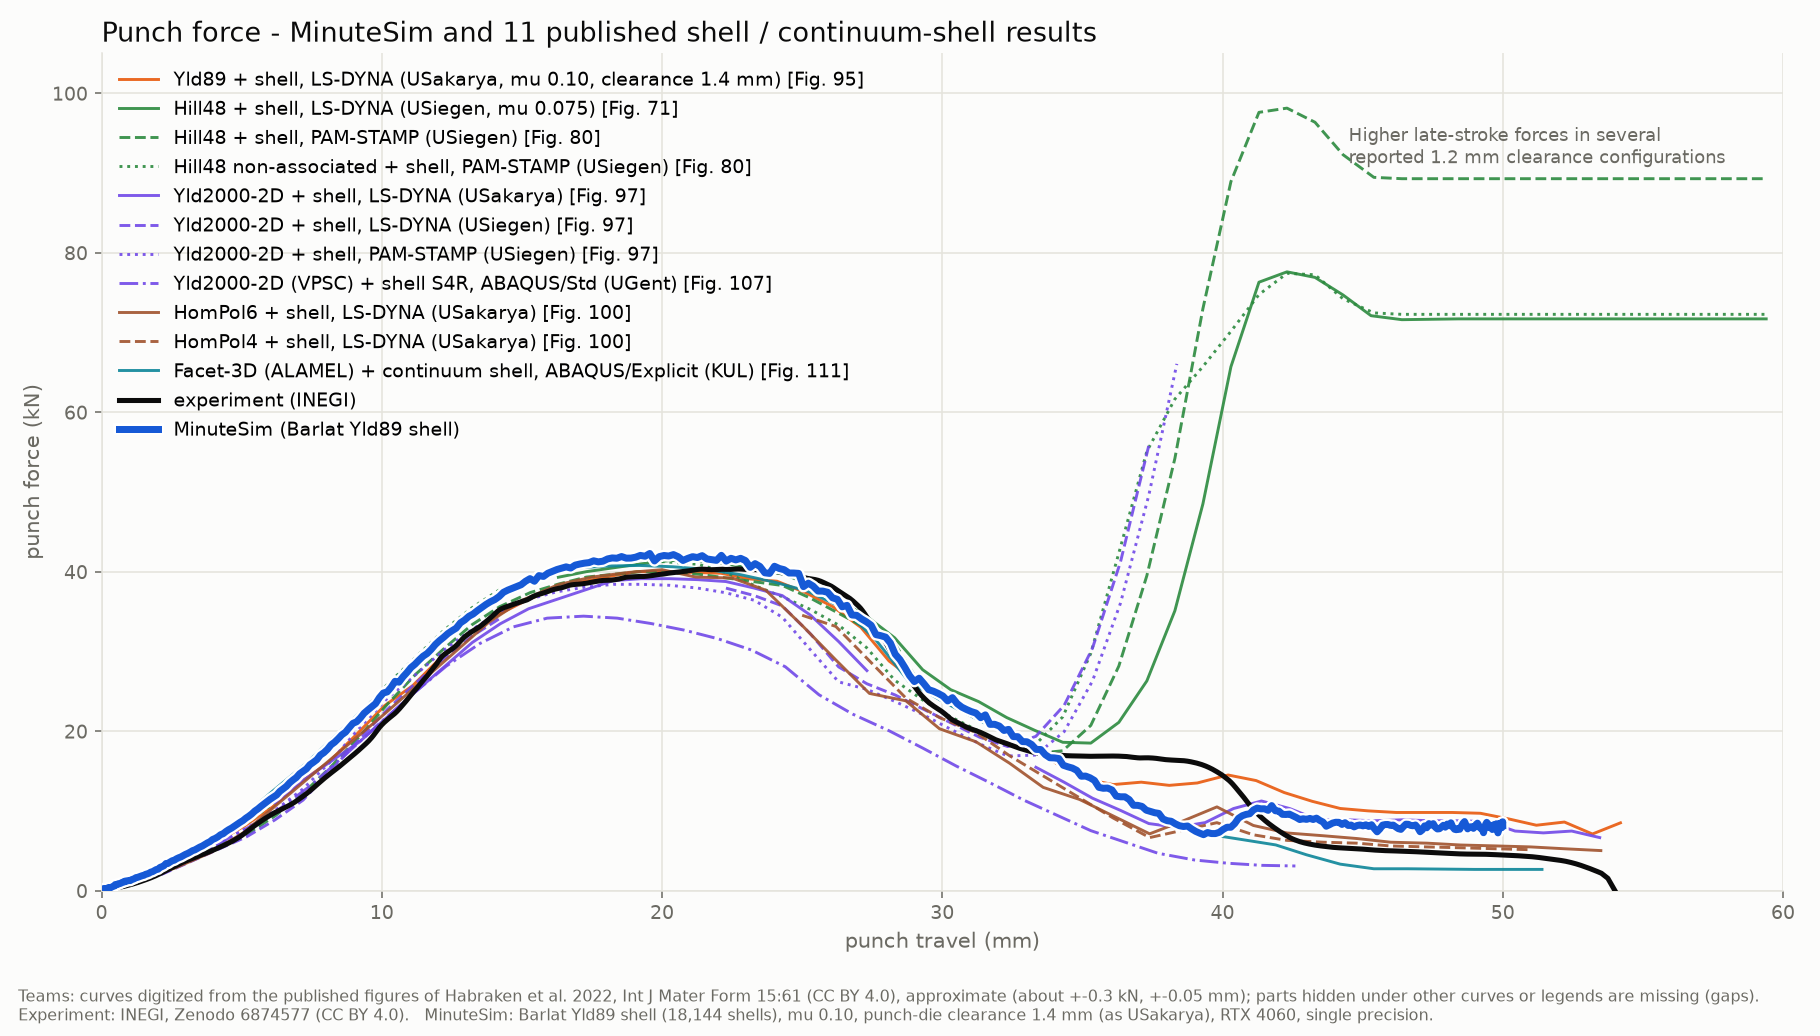
Swipe across the chart, or open it at full size.
02 / Final shape
Earing around the full rim.
Open full-size chart ↗Angle is measured from the rolling direction. Lower profiles, larger amplitudes and small-ear responses in the digitized set remain visible; no participant curves are excluded for their level of agreement.
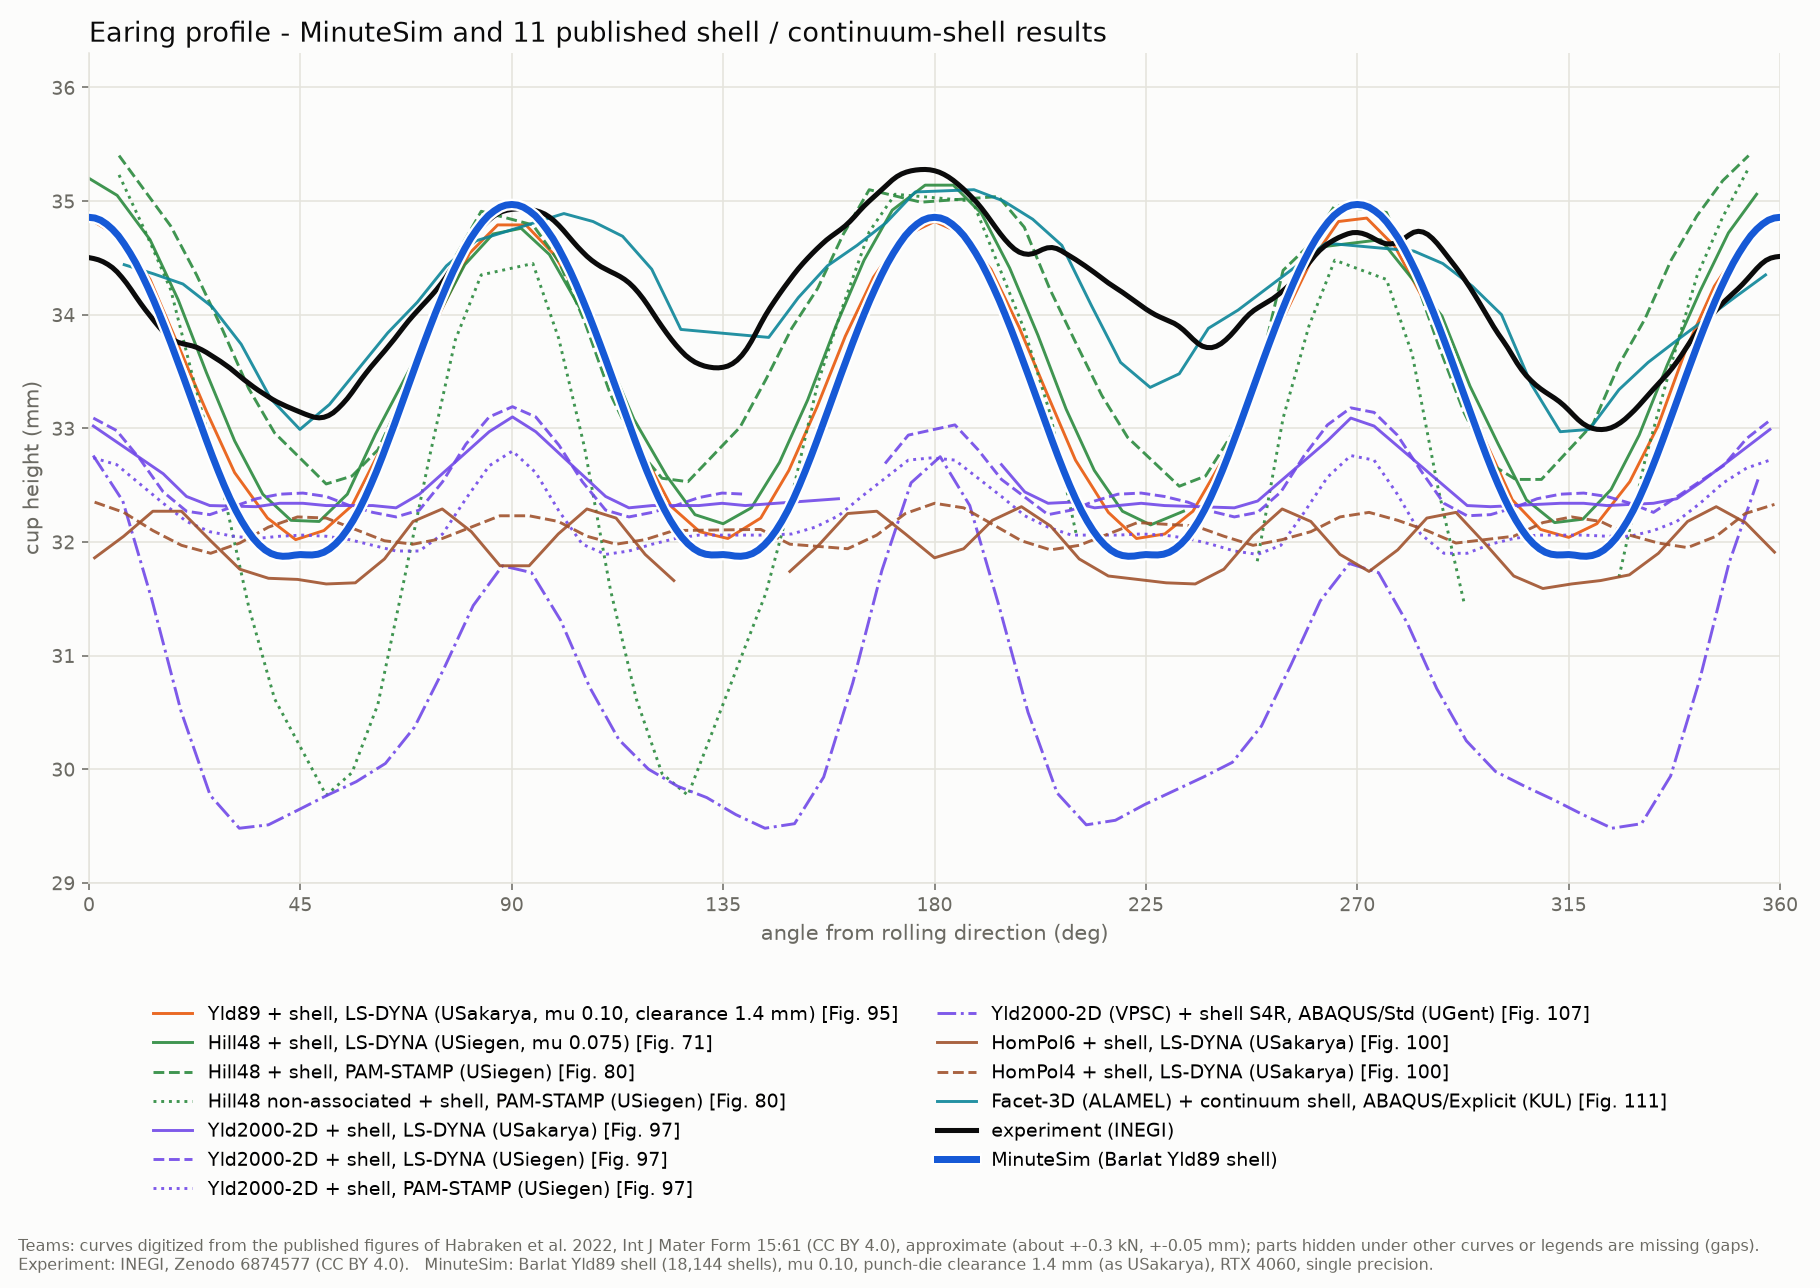
Swipe across the chart, or open it at full size.
03 / Drawing and ironing
Drawing and late-stroke force maxima.
Open full-size chart ↗The bars use drawing travel <30 mm and late-stage travel ≥35 mm; 30–35 mm is not part of either interval. A “+” marks an incomplete, off-scale curve and therefore a lower bound, not a known maximum. A hidden source segment is marked as missing, never zero.
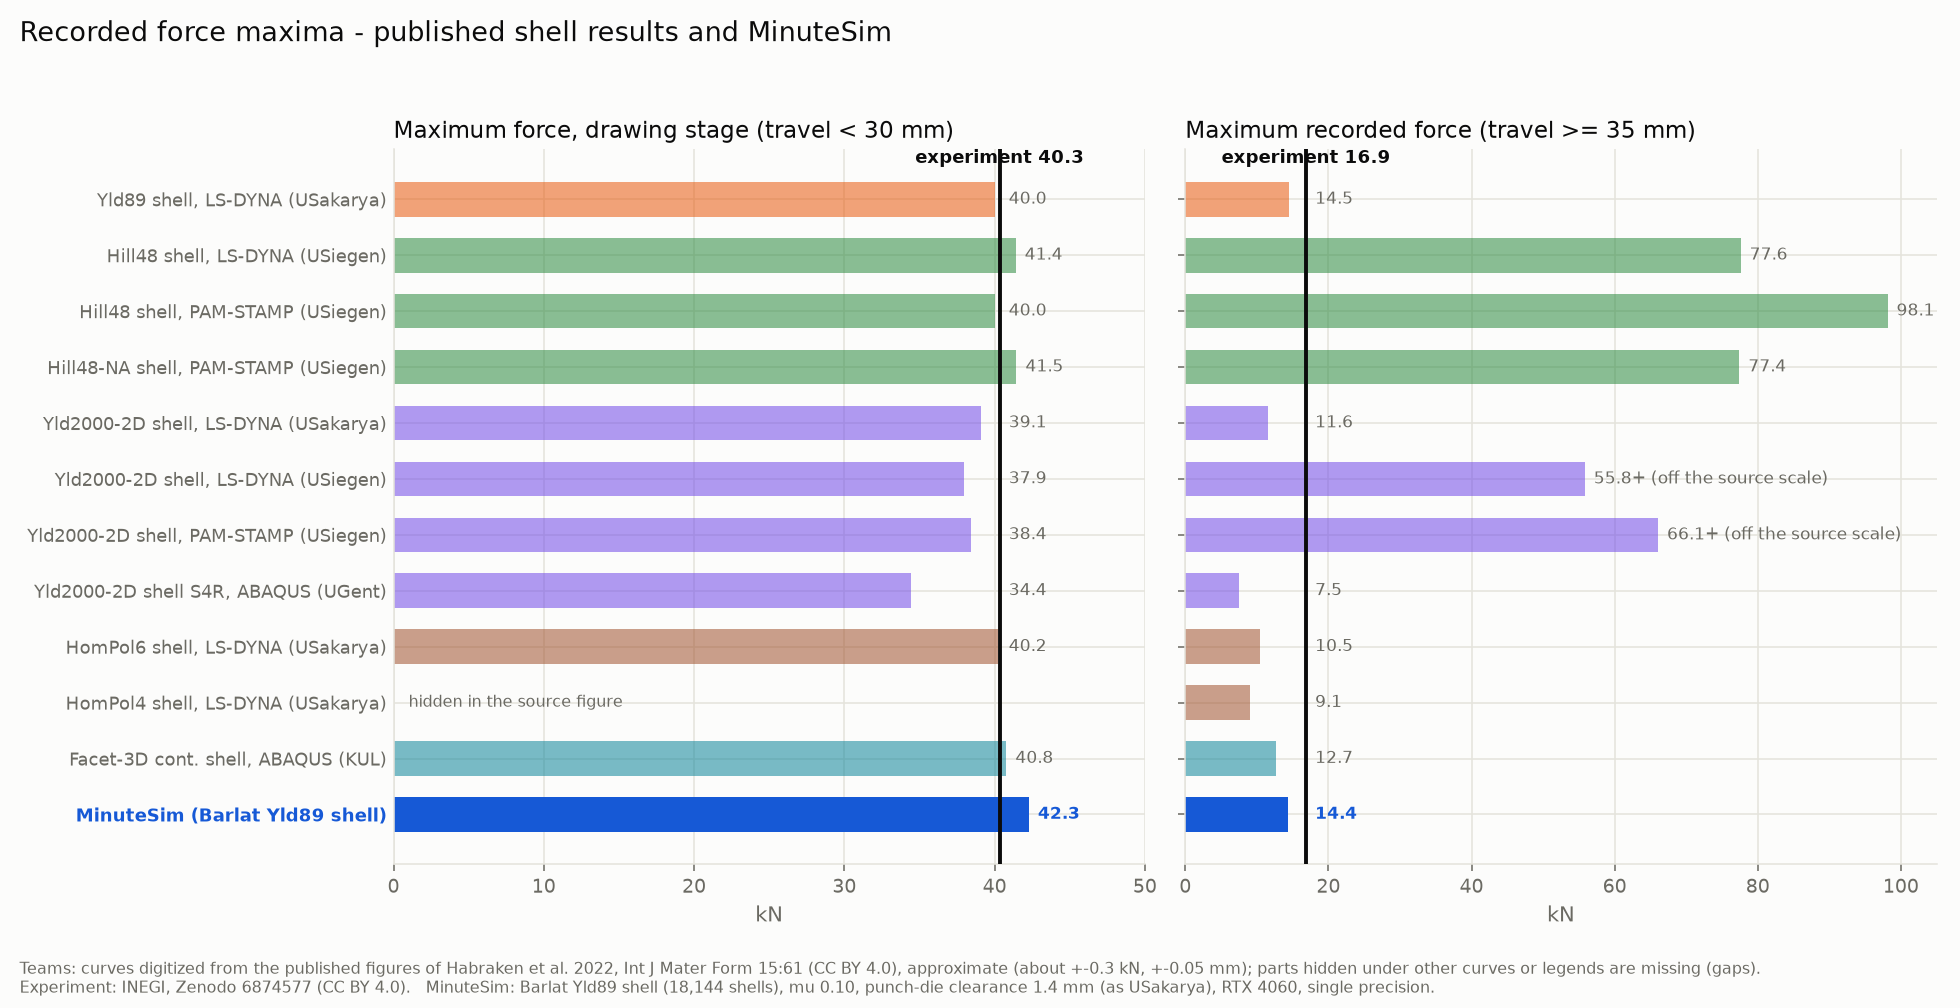
Swipe across the chart, or open it at full size.
Selected response values
MinuteSim and experiment are shown together, including the later stroke where the force curves separate.
| Quantity | MinuteSim | Experiment |
|---|---|---|
| Drawing peak (<30 mm travel) | 42.28 kN | 40.34 kN |
| Maximum recorded force (≥35 mm travel) | 14.36 kN | 16.88 kN |
| Force near 45 mm travel | 8.12 kN | 5.20 kN |
| Force near 50 mm travel | 8.14 kN | 4.47 kN |
| Mean cup height | 33.30 mm | 34.14 mm |
| Ear amplitude (maximum − minimum) | 3.10 mm | 2.29 mm |
MinuteSim forces near 45 and 50 mm are averages within ±0.5 mm of each travel. Experimental values are interpolated at those travels. Peaks are maxima in the stated intervals, not time-averaged forces. The mean-height and amplitude definitions are described below.
Model and reference
Conditions behind the curves.
Geometry and mesh
Full 360° circular blank: diameter 107.5 mm, initial thickness 0.98 mm. 18,144 Quad4 · fully integrated assumed strain shells with five through-thickness integration points. Rigid punch: diameter 60 mm, corner radius 5 mm. Die: opening diameter 62.8 mm, entry radius 10 mm.
Loading and contact
The punch travels 50 mm in 15 ms after a 1.5 ms settling interval. The experiment used 54 mm to fully draw the cup. The blank-holder force is 40 kN, applied against a stopper. Coulomb friction is assumed to be 0.10 at all three tool–blank contacts. The 1.4 mm radial clearance differs from the nominal 1.2 mm experimental gap.
Material model
AA6016-T4, represented by Barlat–Lian 1989 anisotropic plasticity with exponent 8. Calibration uses r₀/r₄₅/r₉₀ = 0.526/0.253/0.601. The model does not fit the measured directional yield stresses simultaneously. The Swift hardening fit uses the published rolling-direction tensile data and is extrapolated beyond plastic strain 0.184.
Additional assumptions
E = 70 GPa, ν = 0.33 and density = 2,700 kg/m³. The blank-holder inner radius is 31.6 mm. A fixed steel stopper ring, 0.98 mm thick, represents the experimental support. These are model choices rather than additional measured benchmark inputs.
How the comparison is read
Punch force is the magnitude of the axial contact reaction; travel follows the prescribed punch motion. The height curve uses the final rim nodes, measured from the mean bottom midsurface beneath the punch plus half the initial sheet thickness. The mean is taken over the uniformly spaced rim nodes; ear amplitude is maximum minus minimum height. The angular origin follows the initial rolling direction. These definitions match the plotted MinuteSim values; the video color bar measures thickness instead.
Experimental force and rim-height curves come from the published workbooks. The earing plot shows the central experimental profile, without its supplied scatter bounds. The 11 shell and continuum-shell curves are digitized from published figures; their approximate readout uncertainty is ±0.3 kN and ±0.05 mm. Obscured segments remain gaps. Off-scale or partly hidden results do not give complete peak values.
What this case establishes
This is an EXPERIMENTAL benchmark configuration for cup drawing, frictional tool contact and anisotropic sheet plasticity, using a single-precision development result from 14 October 2026. It gives explicit force and shape differences for the model shown. It does not establish reproduction of the nominal experimental tooling or general accuracy for other forming conditions.
The accelerated punch motion peaks near 5.2 m/s, whereas the experiment used 0.5 mm/s. A quasi-static energy check and an independent loading-speed sensitivity study have not been established for this result. Speed effects therefore remain unresolved. A two-mesh comparison used 8,064 and 18,144 shells. Ear amplitude changed from 3.26 to 3.10 mm, and the later-stroke force remained mesh-sensitive. This is not an asymptotic convergence result.
Sources and attribution
Experiment and material data: Vincze, G.; Santos, A.D.; Oliveira, M.C.; Lopes, A.B.; Kuwabara, T.; Habraken, A.-M.; Cazacu, O.; and Barlat, F. (2022), Data of The First ESAFORM benchmark EXACT. The INEGI force–stroke and earing workbooks supply the experimental curves; the TUAT tensile measurements supply the material calibration.
Published simulations: Habraken et al. (2022), Analysis of ESAFORM 2021 cup drawing benchmark of an Al alloy, critical factors for accuracy and efficiency of FE simulations, International Journal of Material Forming 15, 61. The shell comparisons refer to Figures 71, 80, 95, 97, 100, 107 and 111.
Both sources are licensed under Creative Commons Attribution 4.0 International. Published simulation curves were digitized and replotted; MinuteSim results and explanatory annotations were added. The source paper and participant input files are not redistributed. Names identify the reported configurations and do not imply endorsement.
EXPERIMENTAL · Benchmark configuration with clearance and loading differences from the experiment. Read the evidence scope.